1 BLAST: A powerful tool in sequence alignment
BLAST is a rapid and efficient sequence alignment tool that is of vital importance in research such as genomics and proteomics. It can help researchers infer the functions, evolutionary relationships and biological significance of sequences by comparing them. The BLAST function supports comparing the data input by users with whole-genome or protein data and returns reliable comparison results to users. Our website supports two search modes: BLASTN and BLASTP. We will only provide users with reliable results where the E-value is less than 1e-5.
1.1 Operation demonstration
- Mode One BLASTN: Input nucleic acid sequences for retrieval.
- Mode Two BLASTP: Input the amino acid sequence for retrieval.
1.1.1 BLASTN
Mode One BLASTN: Input nucleic acid sequences for retrieval. For example: AAGTATACAGCATCATAAGTAGGGCAACTGCGAAGTAAAGGTAAAAACATAGATACTGCA GACATTGCAGGCAGTAGCTCACACAAAGGTGGCAACGGTCACCTAACGGGCTCTTCAAAA CTTACCCAGTAGACCCACCAATCAGAGCTTCAAATTATTTGTACTGGTTGATTAGGTAG
Choose the species you would like to search for.
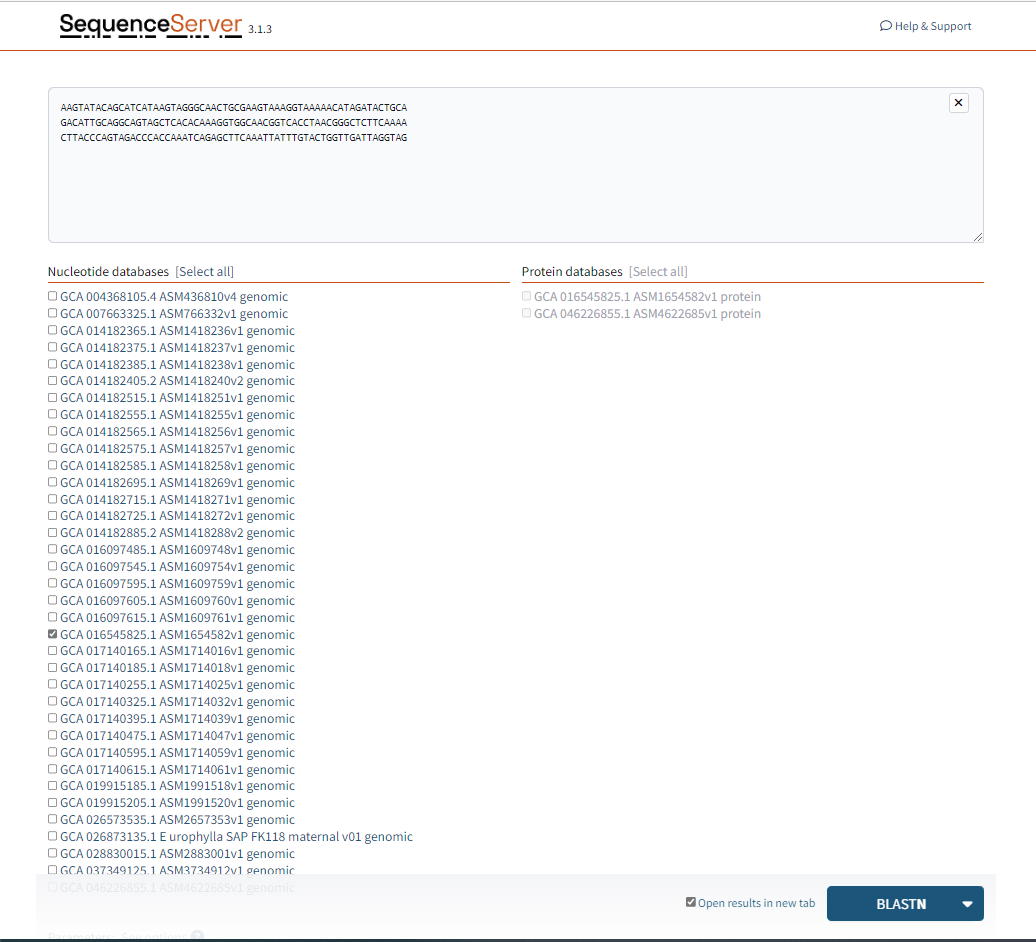
Figure 1.1: A screenshot of the selection for BLASTN.
Clicking BLASTN, after several seconds, the BLASTN result would be listed below.
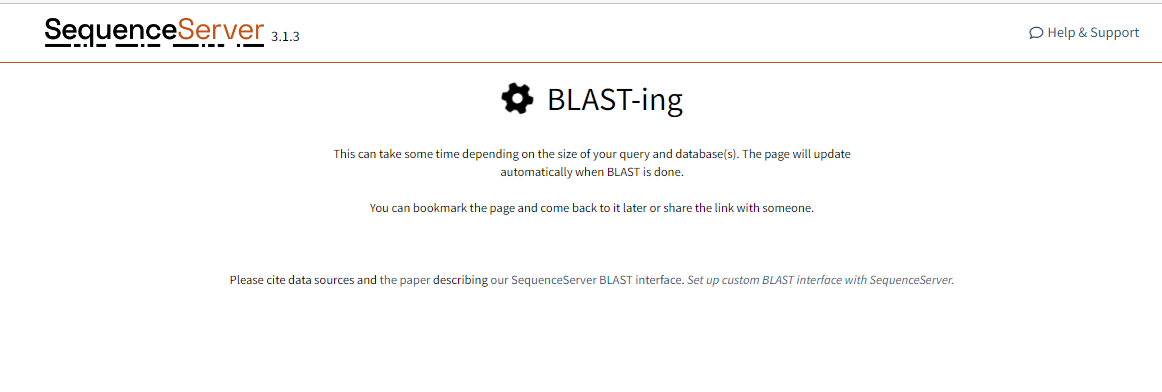
Figure 1.2: Wait for the interface status.
1.1.2 BLASTP
Mode Two BLASTP: Input the amino acid sequence for retrieval. For example: RFPGQLNSDLRKLAVNLIPFPRLHFFMVGFAPLTSRGSQQYRALTVPELTQQMWDSKNMMCAADPRHGRYLTASAMFRGKMSTKEVDEQMLNVQNKNSSYFVEWIPNNVKSTVCDIPPTGG
Choose the species you would like to search for.
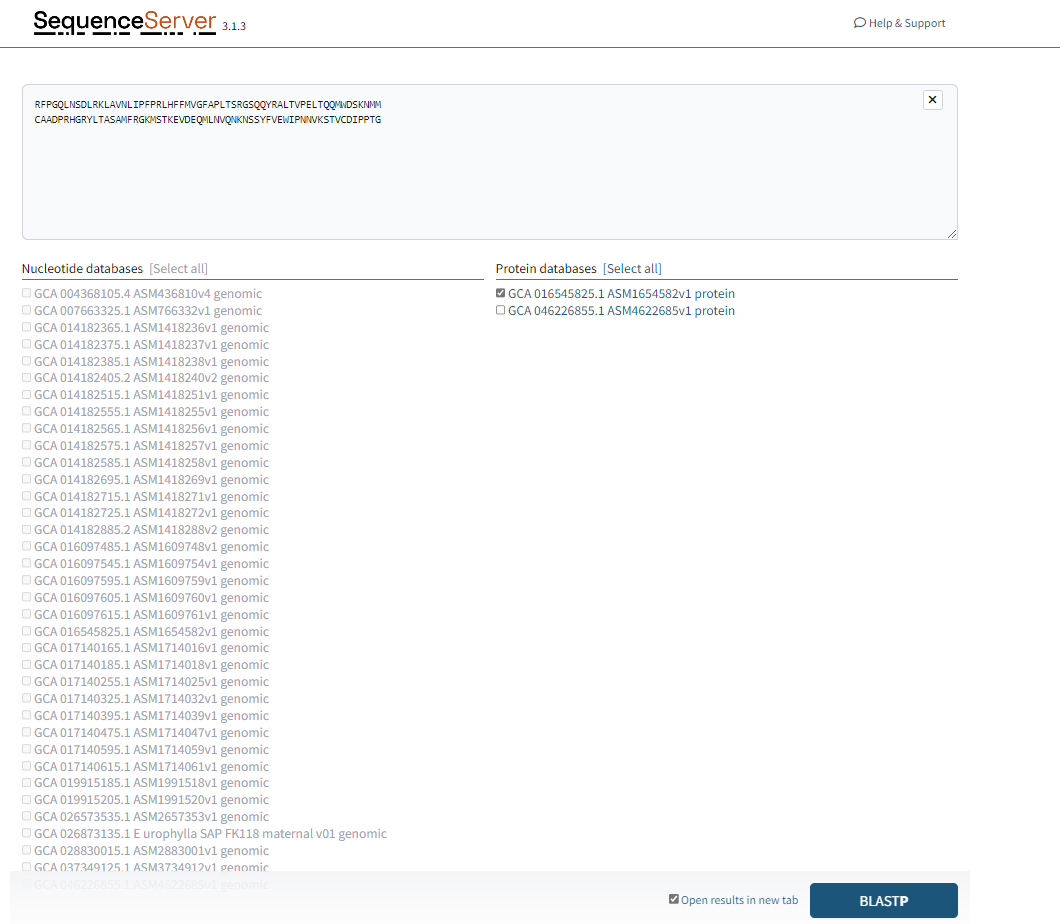
Figure 1.3: A screenshot of the selection for BLASTP.
1.2 BLAST results
1.2.1 BLASTN results
Graphic Overview: This part shows the similarity and alignment quality between the query sequence and each aligned sequence in the database through a Chord diagram. The color changes in the figure indicate the intensity of different matches. The darker the color, the stronger the match.
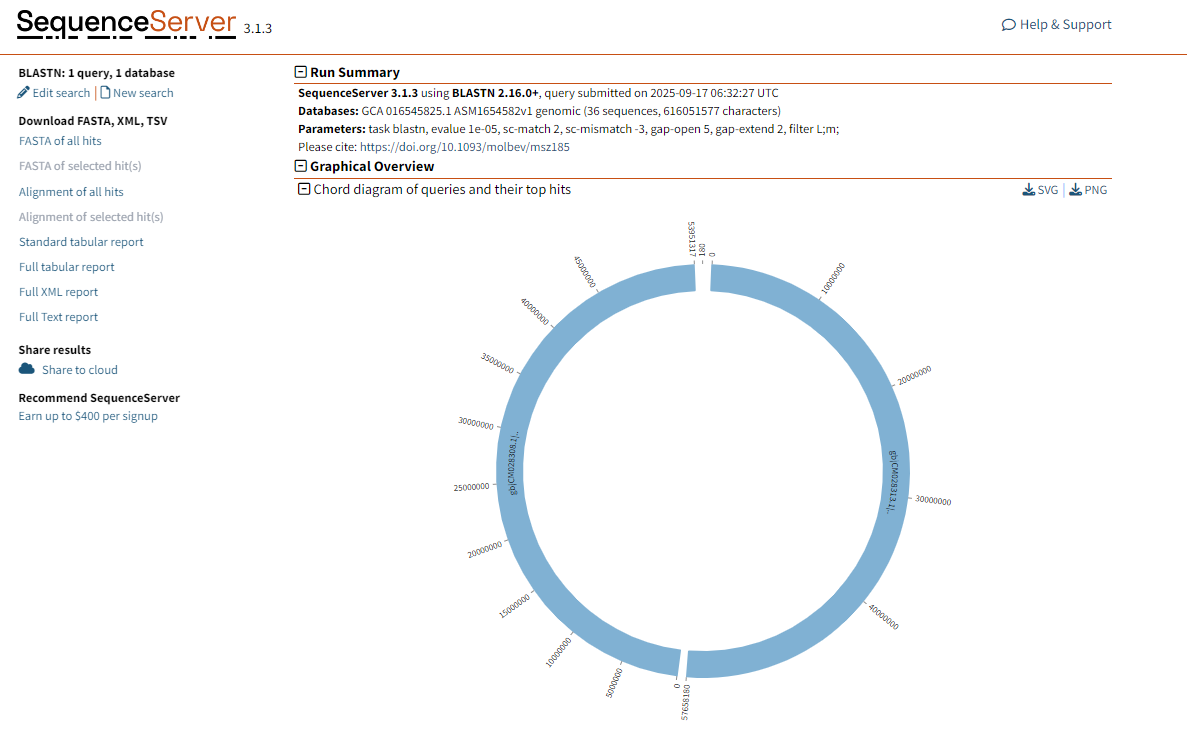
Figure 1.4: BLASTN graphical result display.
1.2.2 Detailed Explanation of the BLASTN Results
This section shows the specific alignment information between the query sequence and the matching sequence in the database. It can be seen that: (1)The alignment of the query sequence with the two chromosome sequences of Eucalyptus grandis isolate (ANB6G69807.140 and ANB6G69807.140 chromosome 1). (2)E-value is 7.33e-88, indicating that the alignment result is very significant and it is almost impossible that it occurred randomly. (3)Identity: If the similarity of the alignment is 100%, it indicates that the query sequence is exactly the same as the matching sequence in the database in this part. (4)Gaps: No Gaps (Gaps = 0), indicating that the alignment is completely aligned.
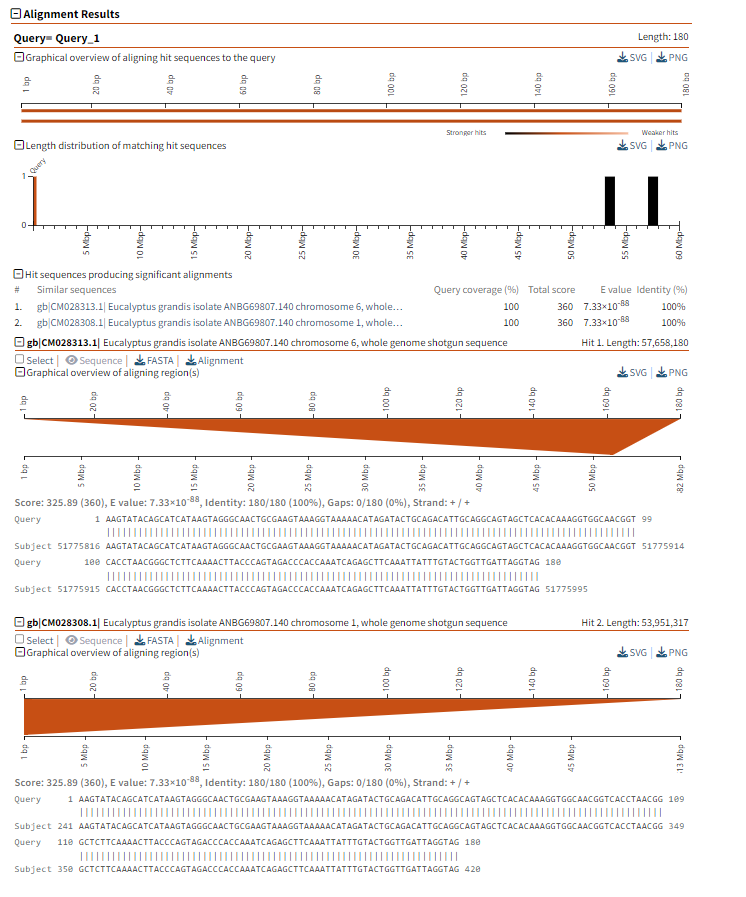
Figure 1.5: BLASTN detailed alignment results.
1.2.3 BLASTP results
This part shows the similarity and alignment quality between the query sequence and each aligned sequence in the database through a Chord diagram. The color changes in the figure indicate the intensity of different matches. The darker the color, the stronger the match.
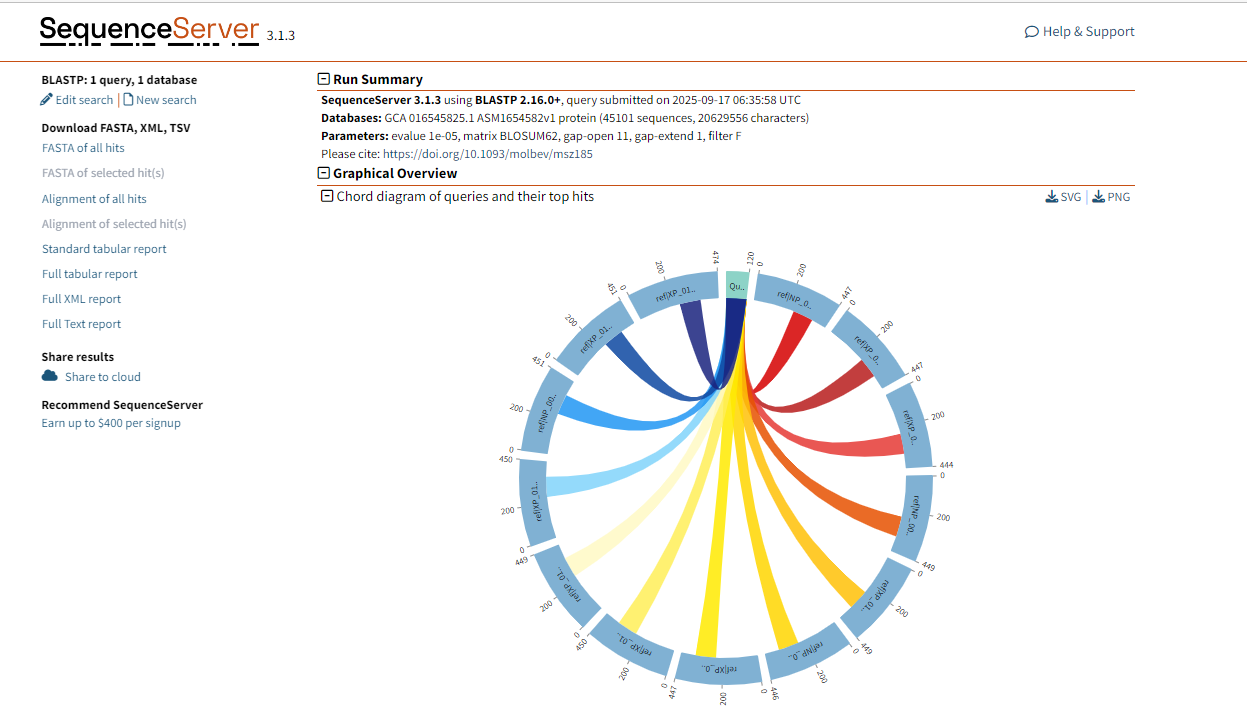
Figure 1.6: BLASTP graphical result display.
1.2.4 Detailed Explanation of the BLASTP Results
(1)Query In the Query section, the query sequence query_1 is used for comparison with the amino acid sequence in the database. The length of the query is 120. (2)Length Distribution of Matching Hit Sequences The bar chart in this section shows the distribution of the lengths of each sequence that matches the query sequence in the database. The bar chart shows strong matches (longer bars) and weak matches (shorter bars), helping users understand which alignments are more significant. (3) Hit sequences producing significant alignments In this section, you can see the top sequences in the database that match the query sequence: Query Coverage: The percentage by which each aligned sequence covers the query sequence. For example, the coverage rate of the first two matching sequences is 100%, indicating complete alignment. Total Score and E-value: These two indicators measure the quality of the alignment. The smaller the E-value, the more significant the alignment result. The alignment result with an E-value of 2.16e-86 indicates that the matching is very significant and is unlikely to have occurred randomly. Identity: Displays the percentage of similarity between the query sequence and the matching sequence. The similarity of the first few matching sequences is 100%, which means they are exactly the same as the query sequence. Sequence name: The name of each matching sequence, for example, ref: NP_001298638.1 and ref: NP_001298638.1 tubulin beta-3 chain [Eucalyptus grandis] etc., providing specific sequence information. (4)Detailed alignment region The specific alignment information shows the alignment between the query sequence and the matching sequence, including the start and end positions of each alignment. For each matching result, you can see the actual alignment of the query sequence and the matching sequence (using lowercase letters to represent mismatched regions and uppercase letters to represent matched parts). (5) Amino acid sequence alignment of query and matching sequences The alignment region shows the amino acid alignment of the query sequence and the matching sequence at their respective positions. For example, the AAGATCG... of the query sequence aligns with the AFRGQ... of the matching sequence, showing similarities and differences.
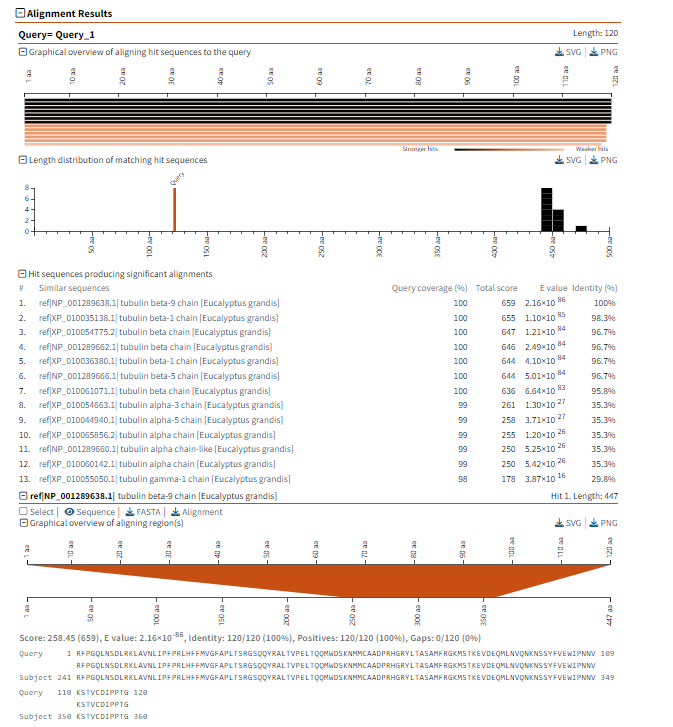
Figure 1.7: BLASTP detailed alignment results.