2 Primer design
Primer design is a core step in molecular biology experiments such as PCR (Polymerase Chain Reaction), qPCR, and gene cloning. The quality of primers directly determines the specificity, efficiency, and reliability of experimental results. Our primer design tool integrates the Primer3 primer design algorithm with BLAST sequence alignment technology to automate the entire process from target region analysis to primer screening. Its specific functions include: accurately designing primers based on target sequences or genomic coordinates, generating candidate primers by incorporating core parameters such as primer length, melting temperature (Tm), and GC content; conducting strict specificity checks by aligning designed primers with reference genome databases to screen out specific primers targeting the target region; and supporting three modes (Full [Design + Check], Design Only, and Check Only) to adapt to different experimental scenarios. Most importantly, this tool can specifically design primers for variant fragment sequences, providing precise support for molecular biology experiments targeting variant regions.
2.1 Demonstration of Operation
- Mode One Full (Design & Check): integrated design + specificity check.
- Mode Tow Design Only: primer design only, no specificity check.
- Mode Three Check Only: specificity verification only for existing primers.
2.1.1 Full (Design & Check)
Select the corresponding database and enter the genomic coordinates of the known target region or the target sequence in the input box of this area according to the required format.
Example: Select "example1"
Option 1 (Genomic coordinates):
seq1 200 10 (Sequence ID, Start Position, Region Length)
seq1 400 10 (Sequence ID, Start Position, Region Length)
Option 2 (Target sequence):
site1 TGTGATATTAAGTAAAGGGAACATTAAACAATCTGCACCAGGATTGAATATCGATACAGATACCCCAACTGCCGCCAATTCACCGACCTTCACCACAAAAAAACTATATTATTCAGCCAATA[GTTACCTGTGTG]ATTTAATAGATAAAGCTACAAAAGCAAGCTTGGTATGATAGTTAATAATAAAAAAAGAAAAAACAAGTATCCAAATGGCCACAAAAGGCTGTATCAACAAGT
site2 ACCAGATTGAATATCGATACAGATACCCCAACTGCCGCCAATTCACCGACCTTCACCACAAAAAAACTATATTATTCAC[GC]CAATAGTTACCTGTGTGATTTAATAGATAAAGCTACAAGCAAGCTTGGTATGATAGTATTAATATAAAAAAAGAAAAAACAAGTATCCAAATGGCC
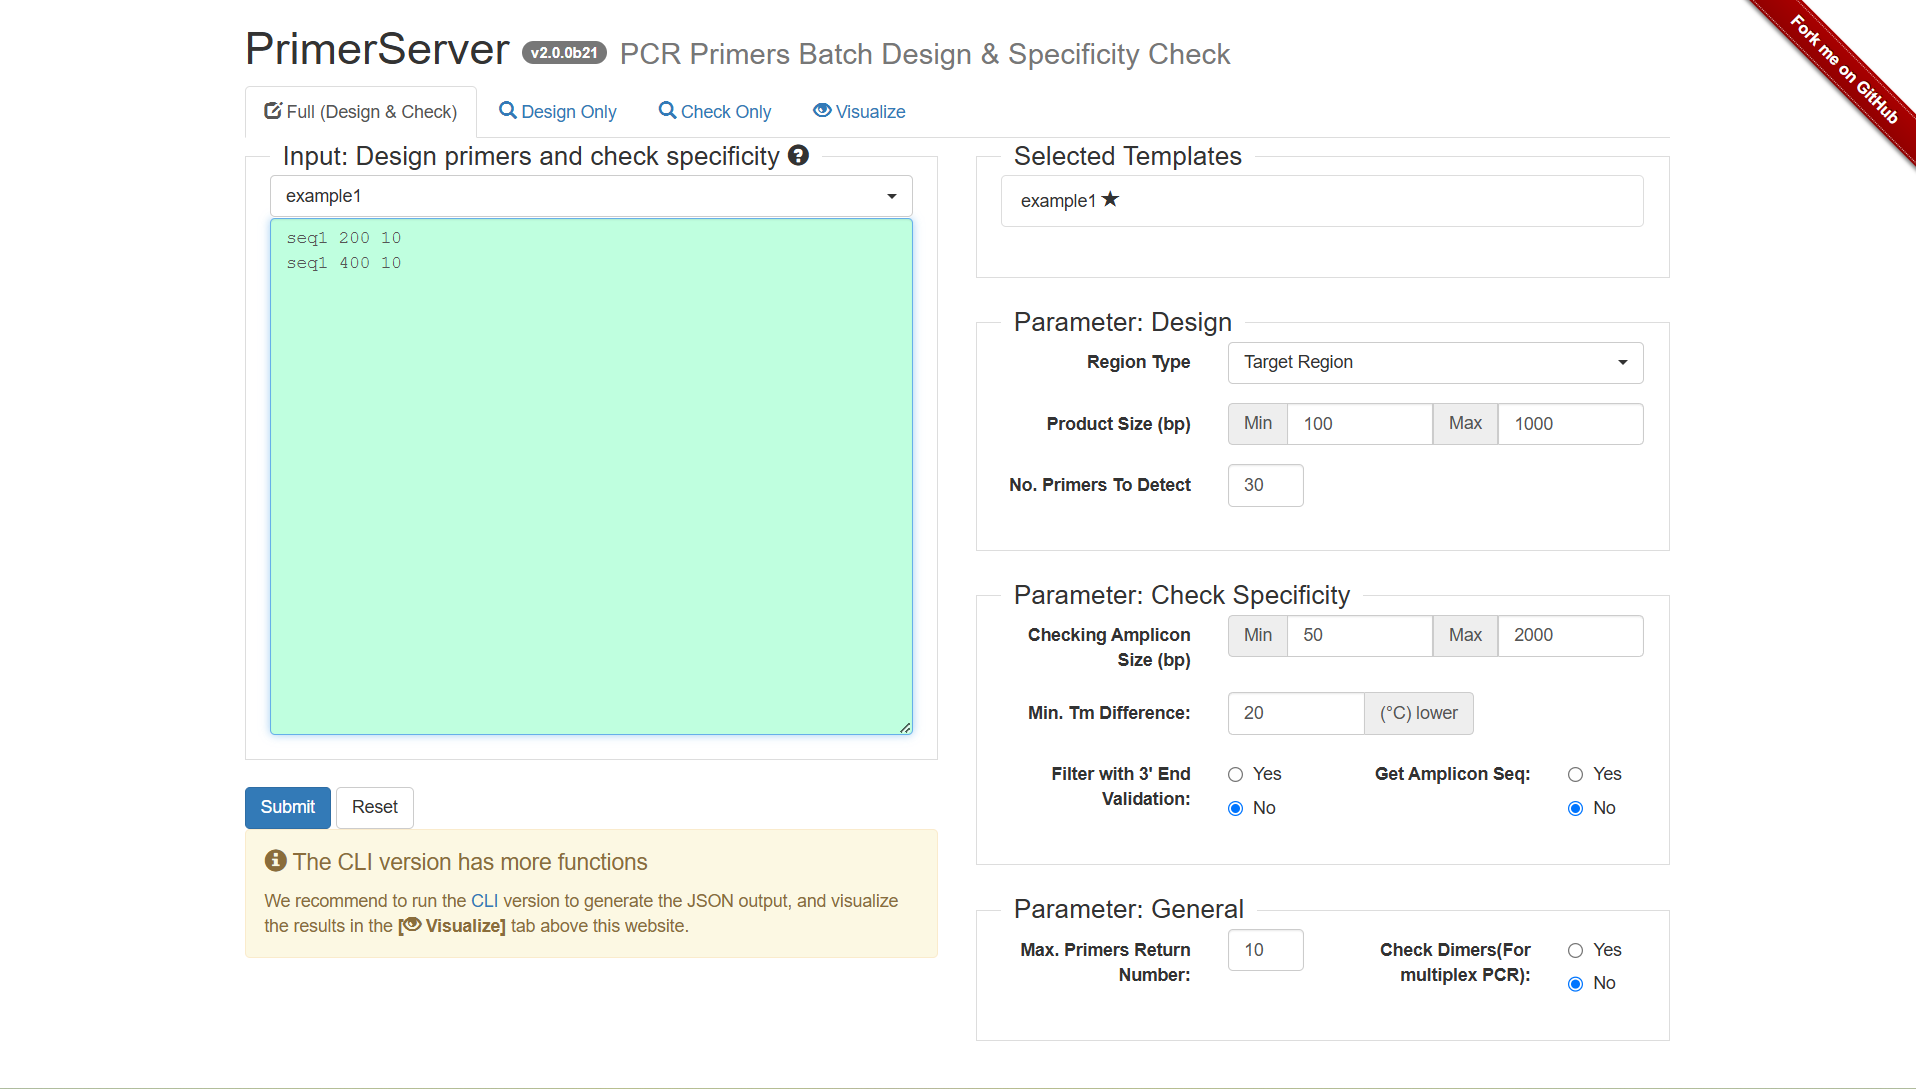
Figure 2.1: A screenshot of the one type of selection for Full (Design & Check).
Clicking Submit, after several seconds, the primer results would be listed below.
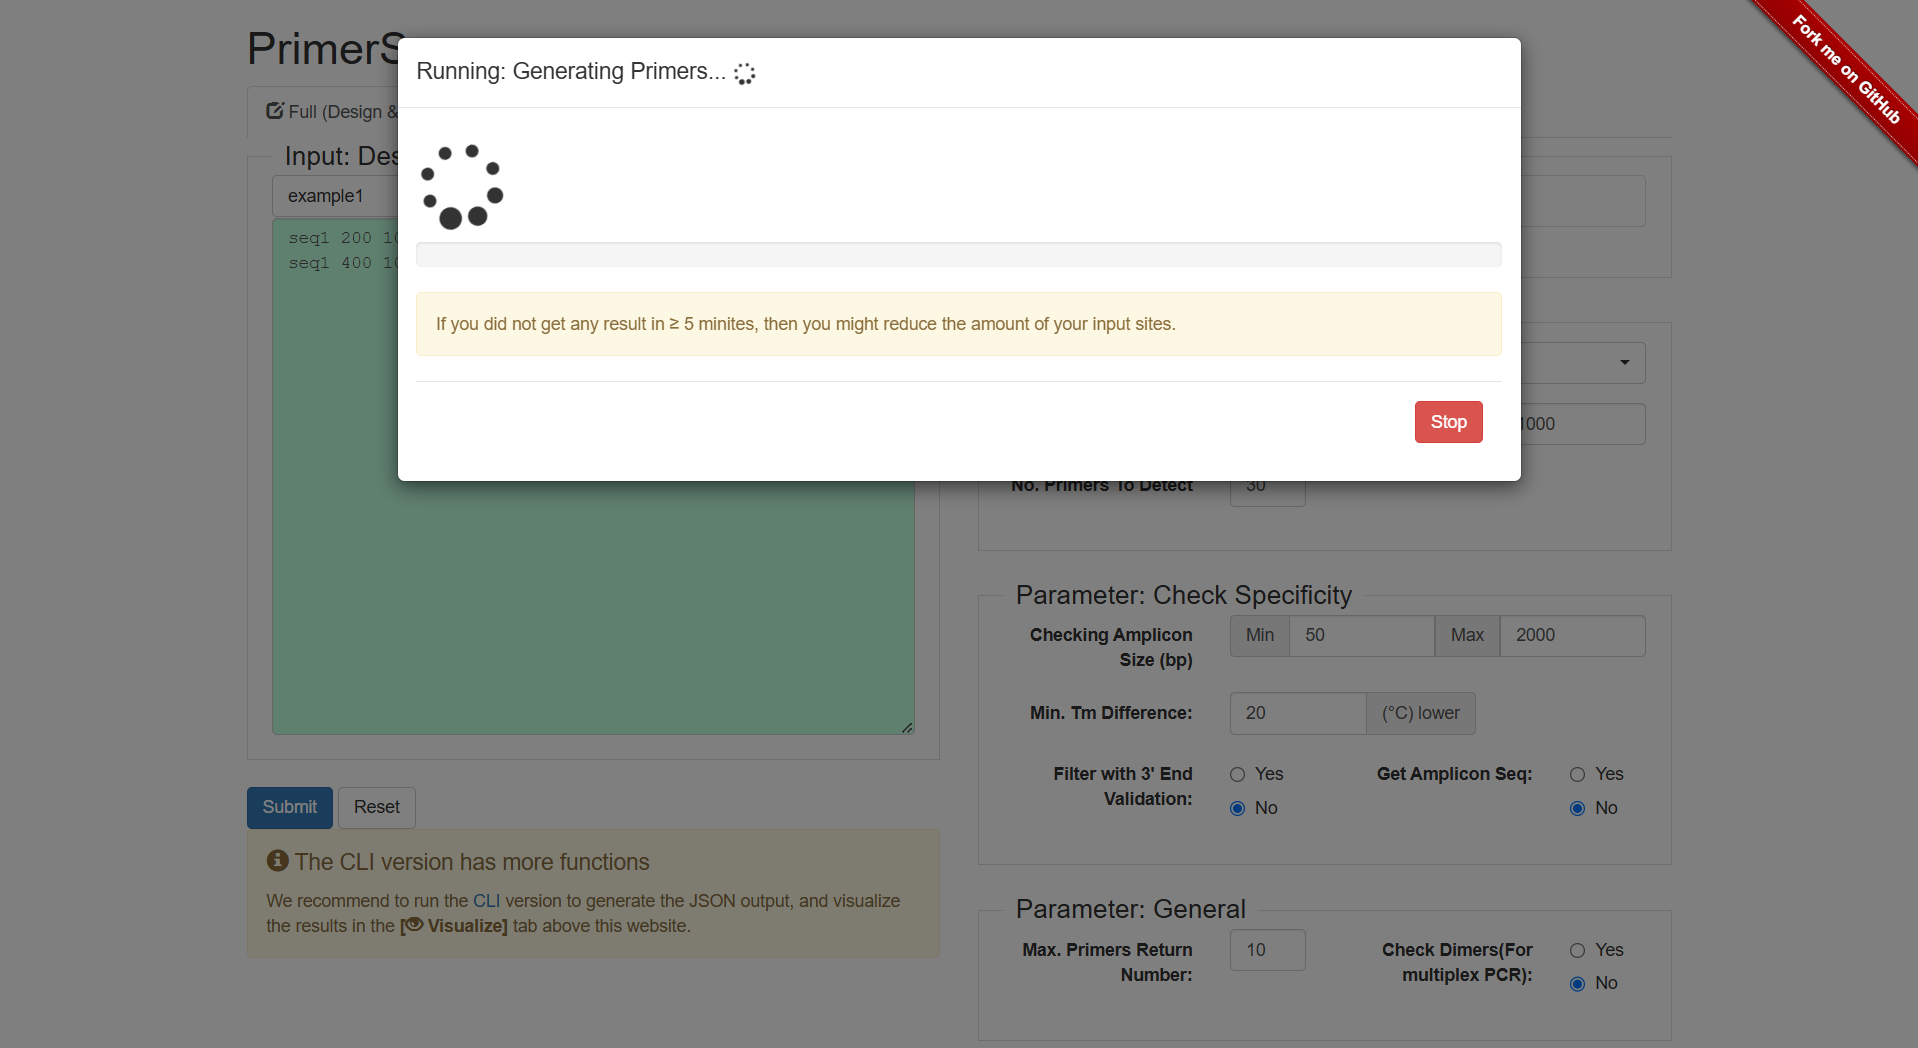
Figure 2.2: Wait for the interface status.
2.1.2 Design Only
Select the corresponding database and enter the genomic coordinates of the known target region or the target sequence in the input box of this area according to the required format.
Example: Select "example1"
Option 1 (Genomic coordinates):
seq1 200 10 (Sequence ID, Start Position, Region Length)
seq1 400 10 (Sequence ID, Start Position, Region Length)
Option 2 (Target sequence):
site1 TGTGATATTAAGTAAAGGGAACATTAAACAATCTGCACCAGGATTGAATATCGATACAGATACCCCAACTGCCGCCAATTCACCGACCTTCACCACAAAAAAACTATATTATTCAGCCAATA[GTTACCTGTGTG]ATTTAATAGATAAAGCTACAAAAGCAAGCTTGGTATGATAGTTAATAATAAAAAAAGAAAAAACAAGTATCCAAATGGCCACAAAAGGCTGTATCAACAAGT
site2 ACCAGATTGAATATCGATACAGATACCCCAACTGCCGCCAATTCACCGACCTTCACCACAAAAAAACTATATTATTCAC[GC]CAATAGTTACCTGTGTGATTTAATAGATAAAGCTACAAGCAAGCTTGGTATGATAGTATTAATATAAAAAAAGAAAAAACAAGTATCCAAATGGCC
Adjust the "Parameter: Design" and "Parameter: General" settings.
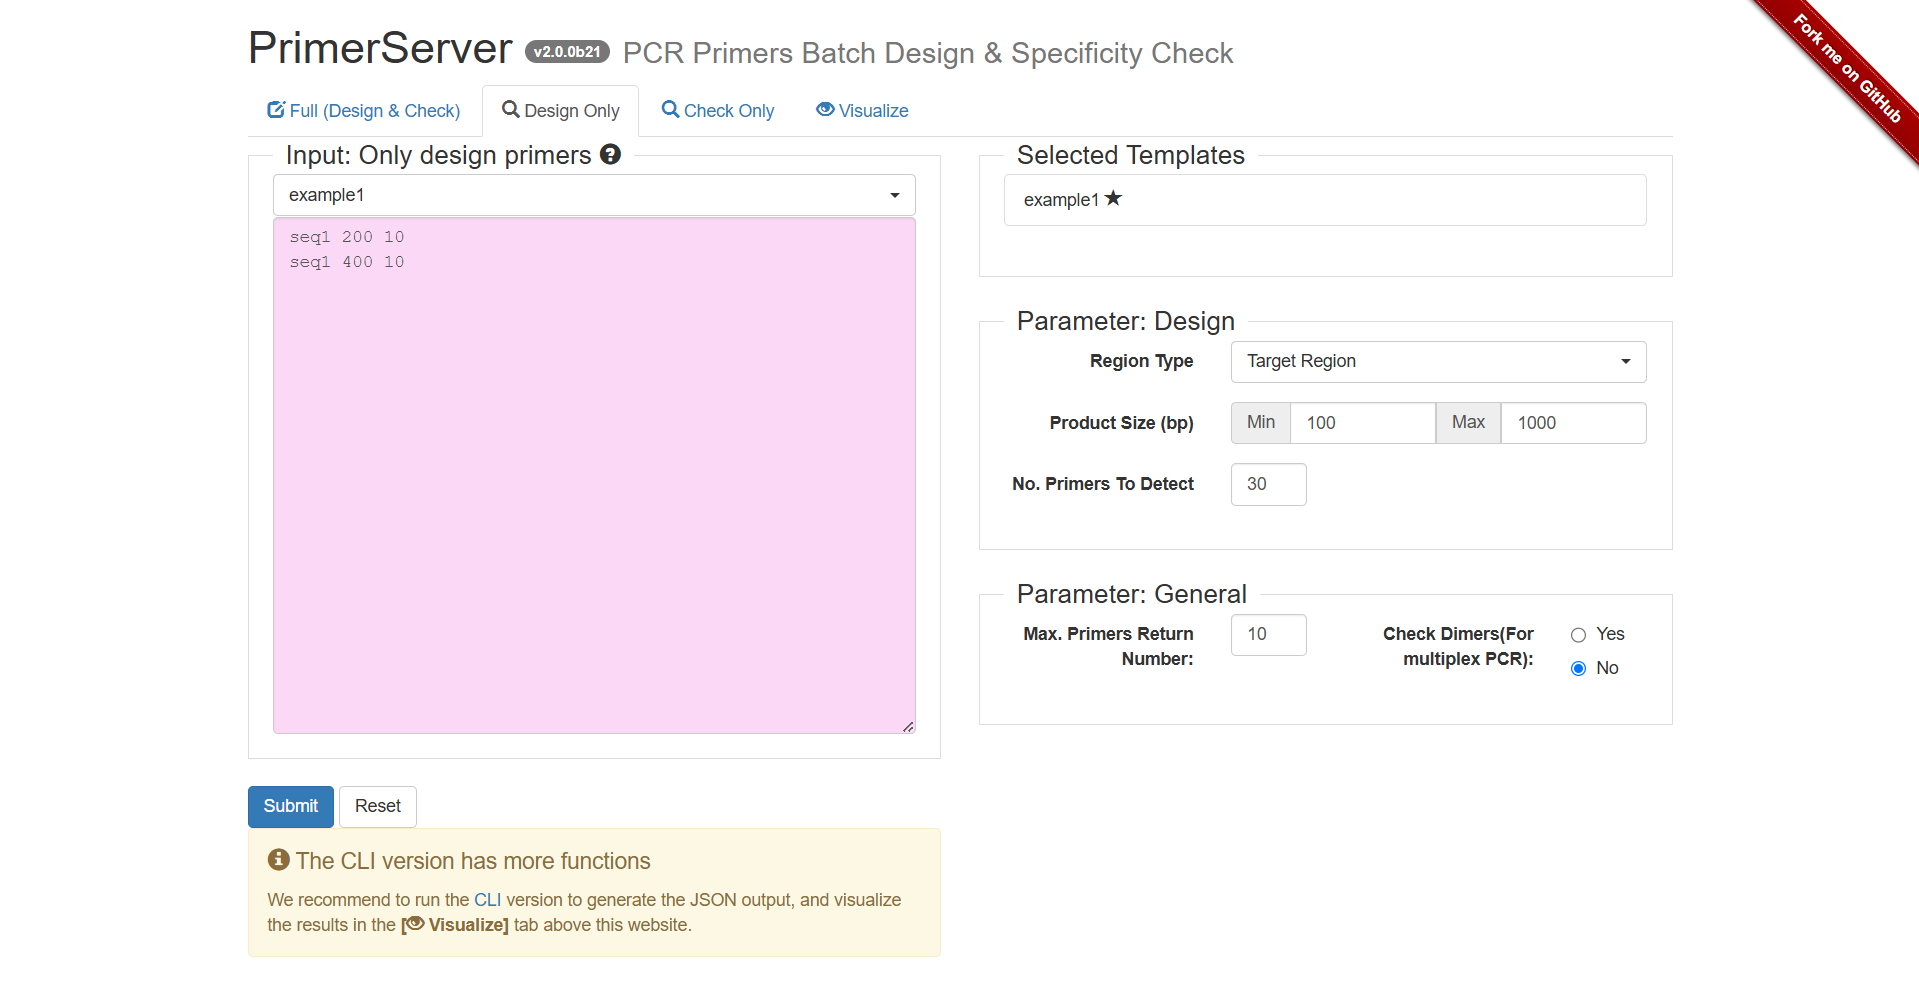
Figure 2.3: A screenshot of the one type of selection for Design Only.
Clicking Submit, after several seconds, the primer results would be listed below.
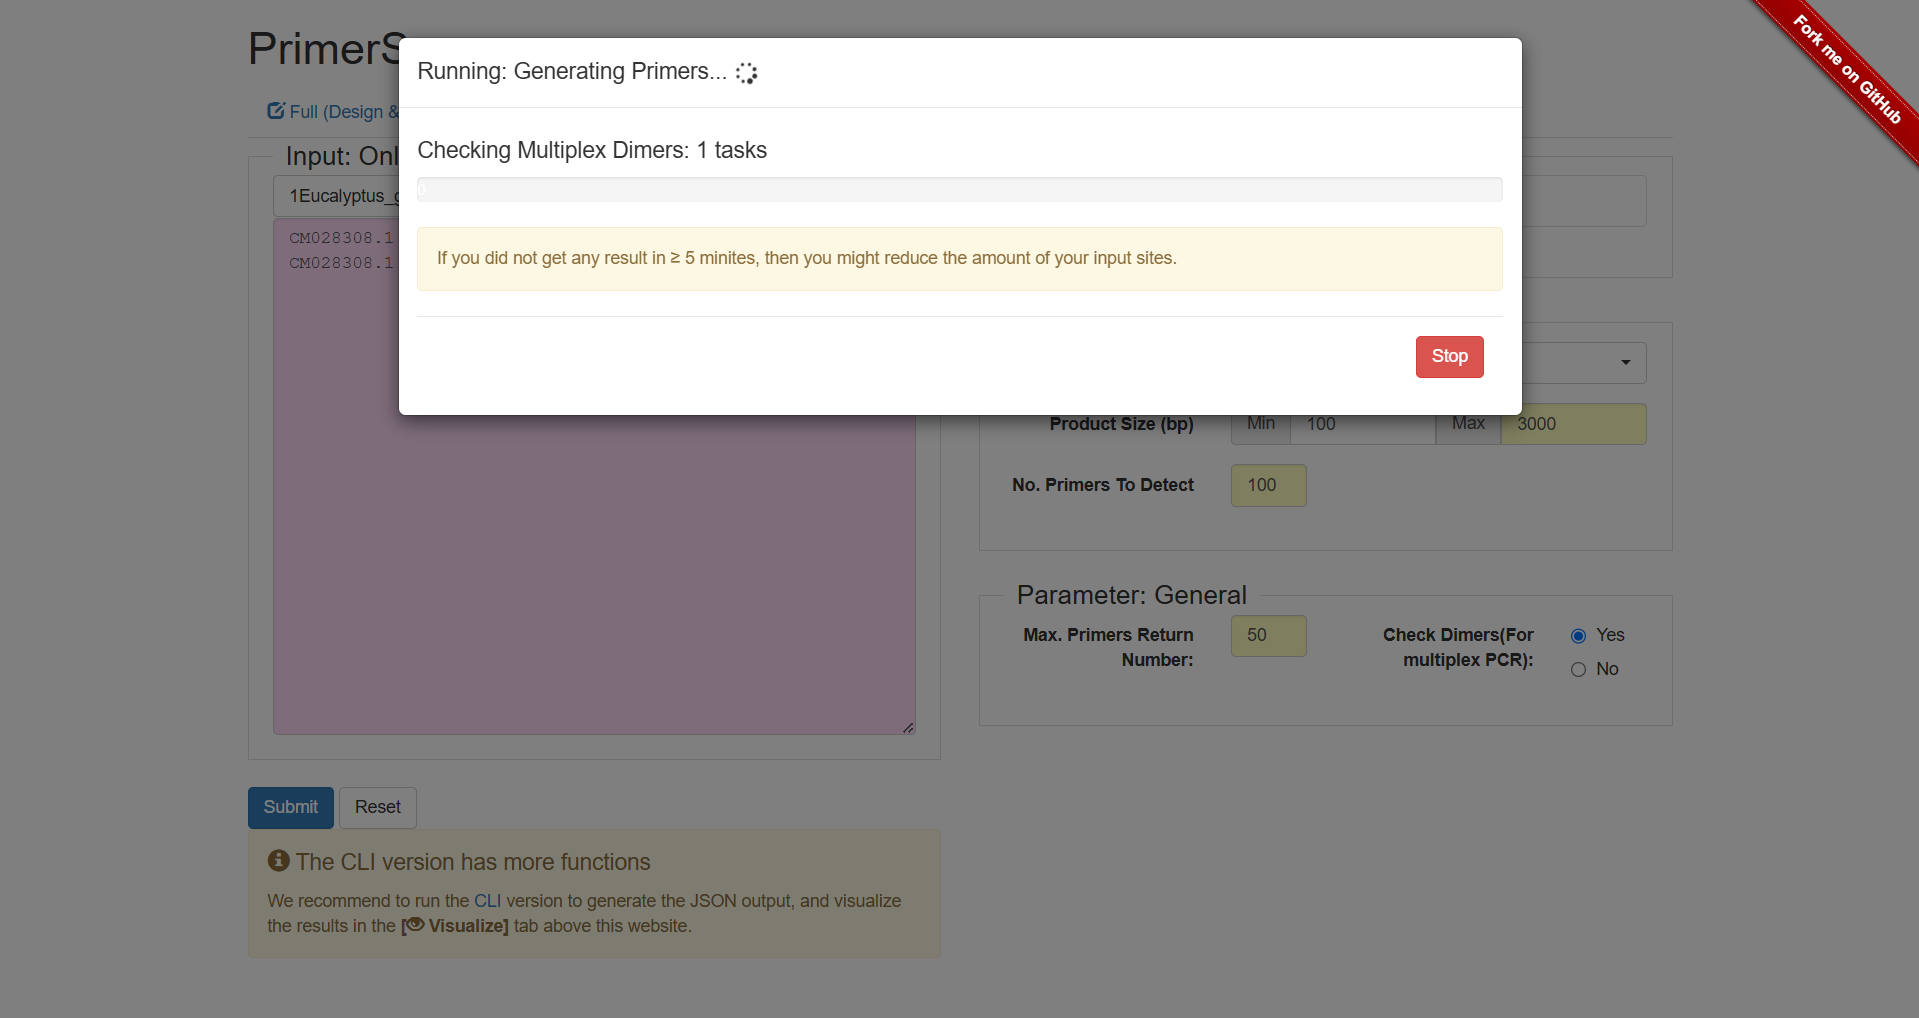
Figure 2.4: Wait for the interface status.
2.1.3 Check Only
Select the corresponding database and enter the known primer sequences in the input box of this area according to the required format.
Example: Select "example1"
Input:
P1 CTTCTGCAATGCCAAGTCCAG GTGGTGAAGGTCGGTTGAA
P2 ACCAAACCCCAGAGTCAATTAA TCTATCTATTGCACTGCCTGTTG
Adjust the "Parameter: Design" and "Parameter: General" settings.
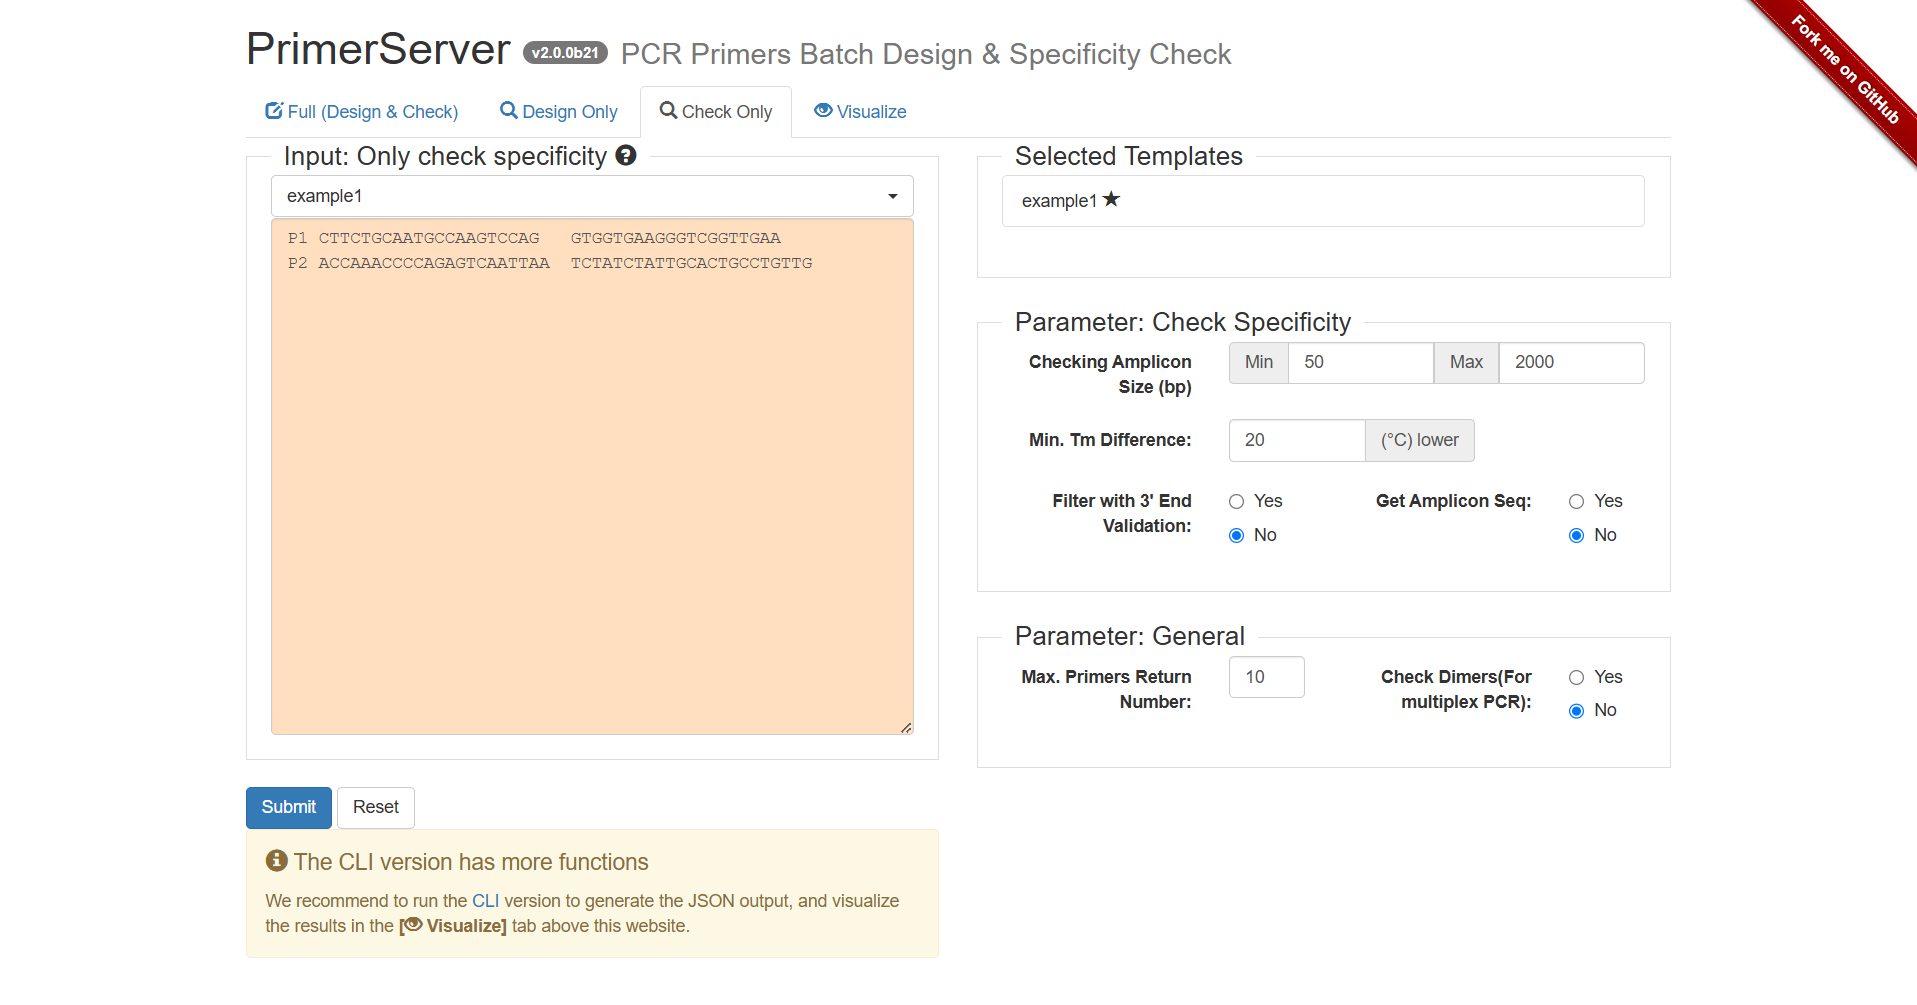
Figure 2.5: A screenshot of the one type of selection for Check Only.
Clicking Submit, after several seconds, the primer results would be listed below.
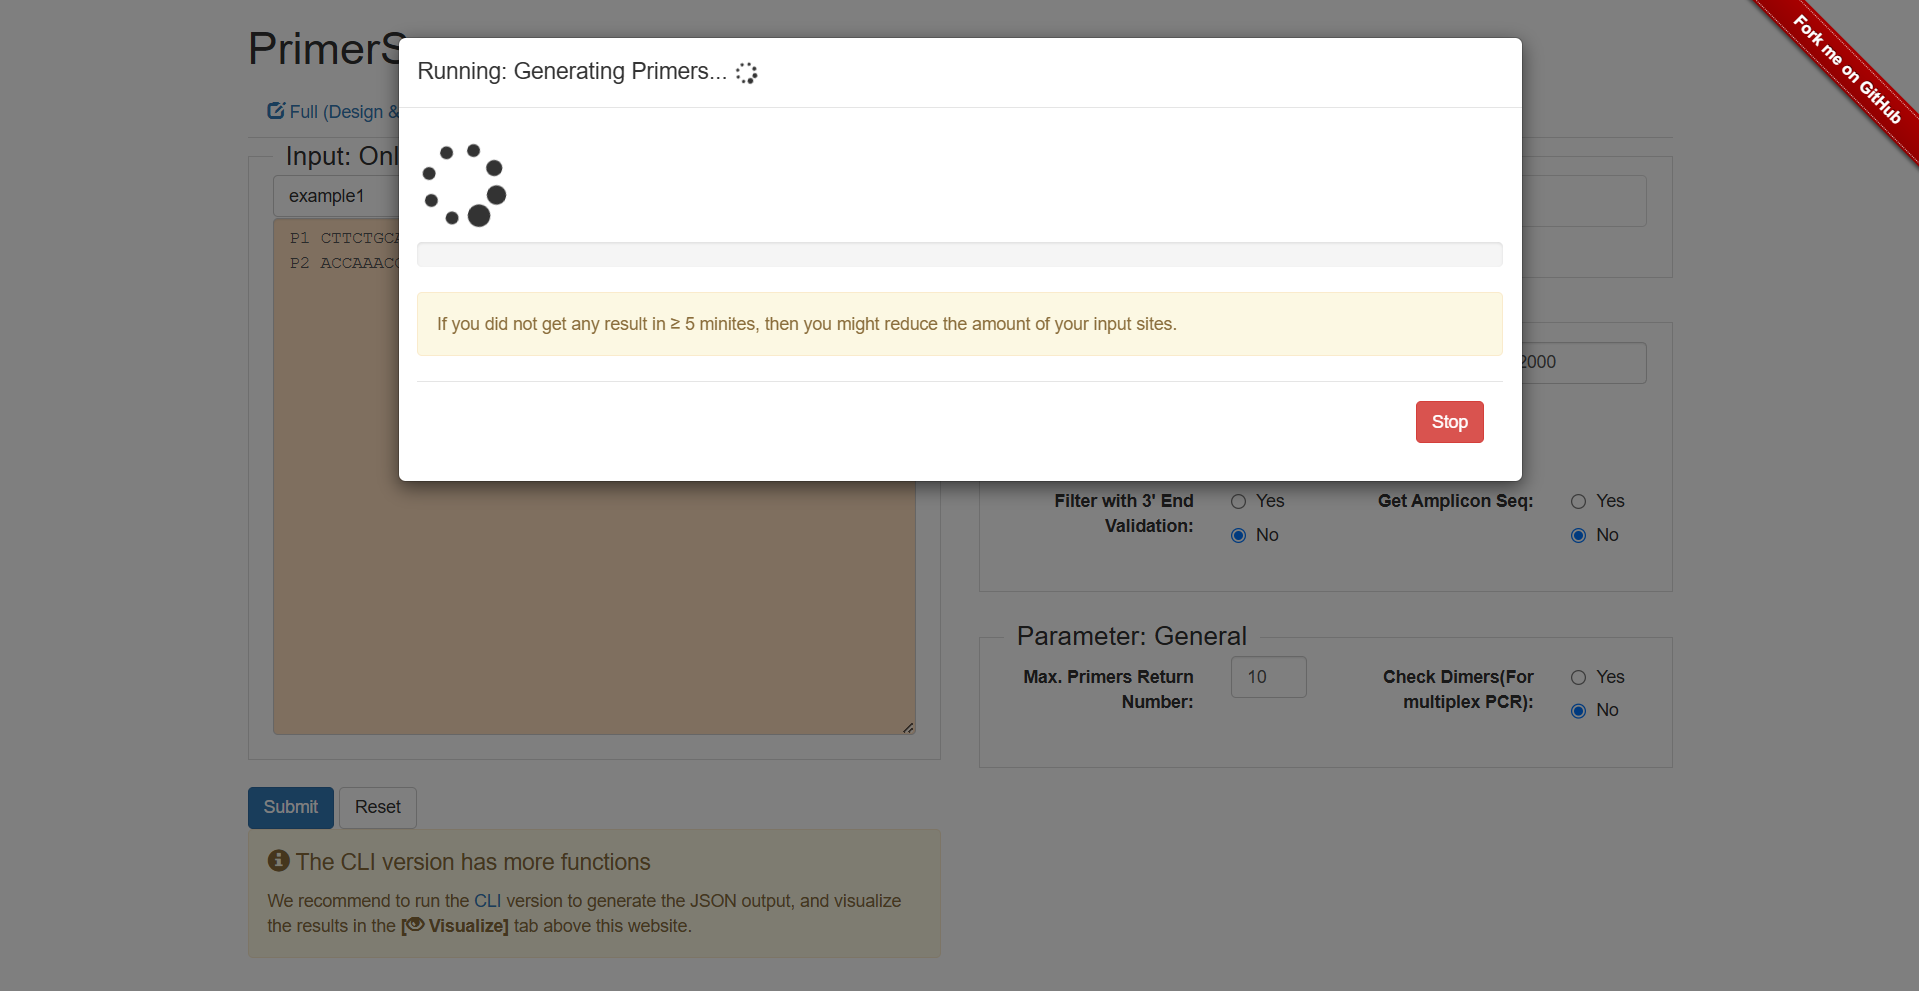
Figure 2.6: Wait for the interface status.
2.2 Result Interpretation
2.2.1 Results of Full (Design & Check) Mode
The blue horizontal line at the top represents the template sequence seq1, with scales indicating base positions (approximately 50 - 500 bp). Black arrows indicate the amplicons (i.e., the range of PCR products) of different primer pairs.
Primers 1 - 8: Marked as "1 Amplicon", indicating that each pair of primers can amplify only 1 target fragment on the template. This is an ideal situation, meaning the primers have good specificity and are less likely to bind to non-target sequences.
Primers 9 - 10: Marked as "2 Amplicons", indicating that each pair of primers can amplify 2 fragments on the template. This suggests a risk of non-specific binding (may bind to other similar sequences on the template), and caution should be exercised in subsequent experiments or further verification is required.
Files in three formats (Table, JSON, SVG) can be downloaded simultaneously.
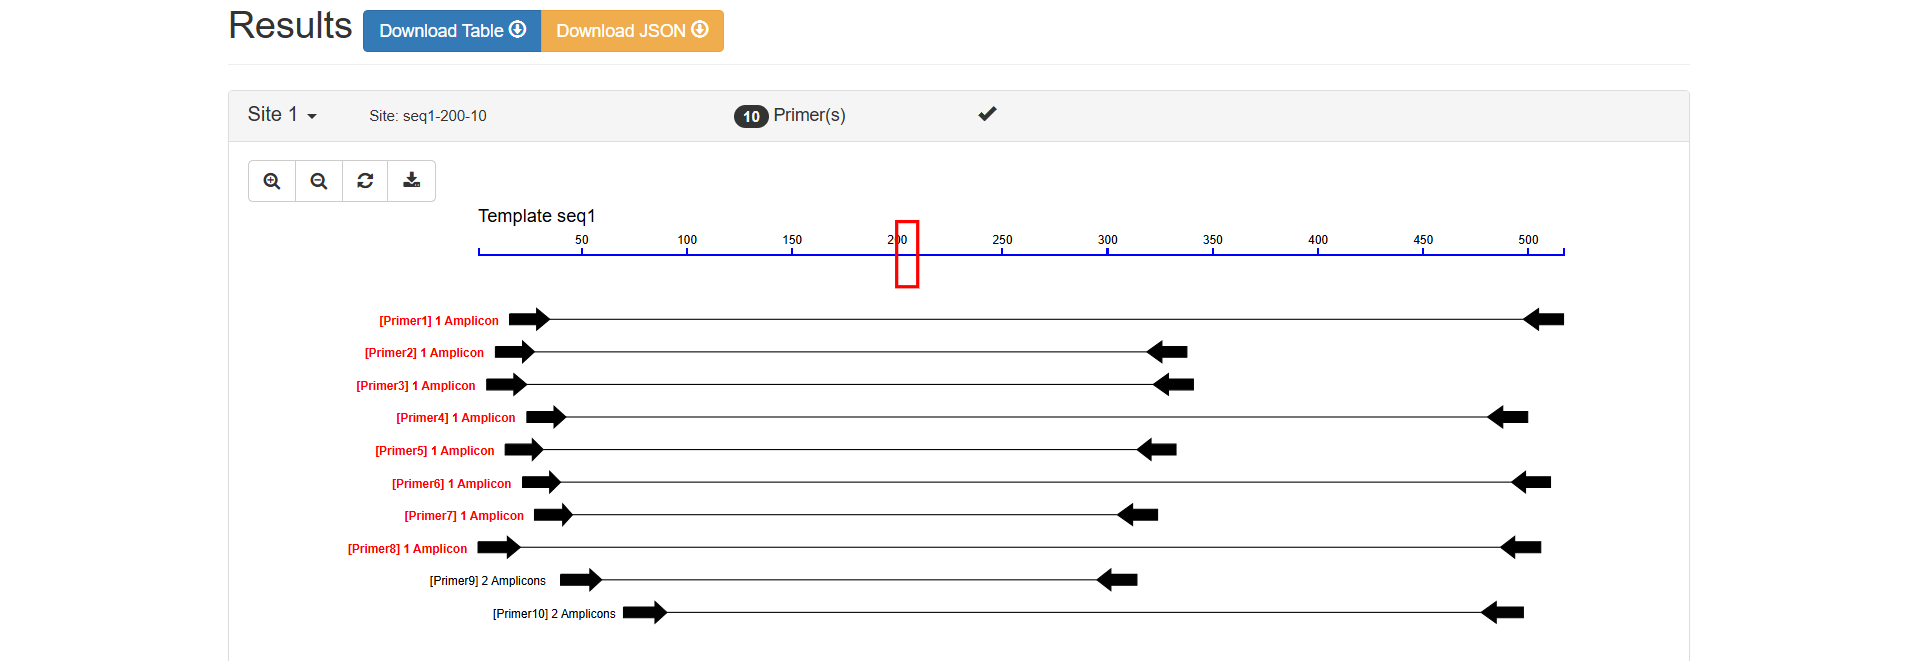
Figure 2.7: Visual Map Analysis result display.
Sequence (5’→3’): GCTTCTGCAATGCCAAGTCC
Length: 20 bp (within the conventional primer length range of 15 - 30 bp)
Position: Binds to positions 16 - 35 of seq1
Tm (Melting Temperature): 60.1℃
GC Content: 55.0% (within the optimal range of 40% - 60%, ensuring the stability of binding between the primer and the template)
Sequence (5’→3’): CTGTTGCATTGGCTTTGGCT
Length: 20 bp
Position: Binds to positions 498 - 517 of seq1
Tm: 60.0℃ (only 0.1℃ difference from the Tm of the forward primer, with good pairing, ensuring that the forward and reverse primers bind to the template simultaneously during PCR)
GC Content: 50.0%
502 bp (calculated from the start position of the forward primer (16) to the end position of the reverse primer (517): 517 - 16 + 1 = 502, consistent with expectations)
0.14 (A lower penalty value indicates higher overall primer quality. 0.14 is a low value, indicating that the primer performs excellently in comprehensive parameters such as length, Tm, and GC content)
Only 1 (seq1:16-517, 502 bp), which further verifies that the primer pair has good specificity and only targets the target region.
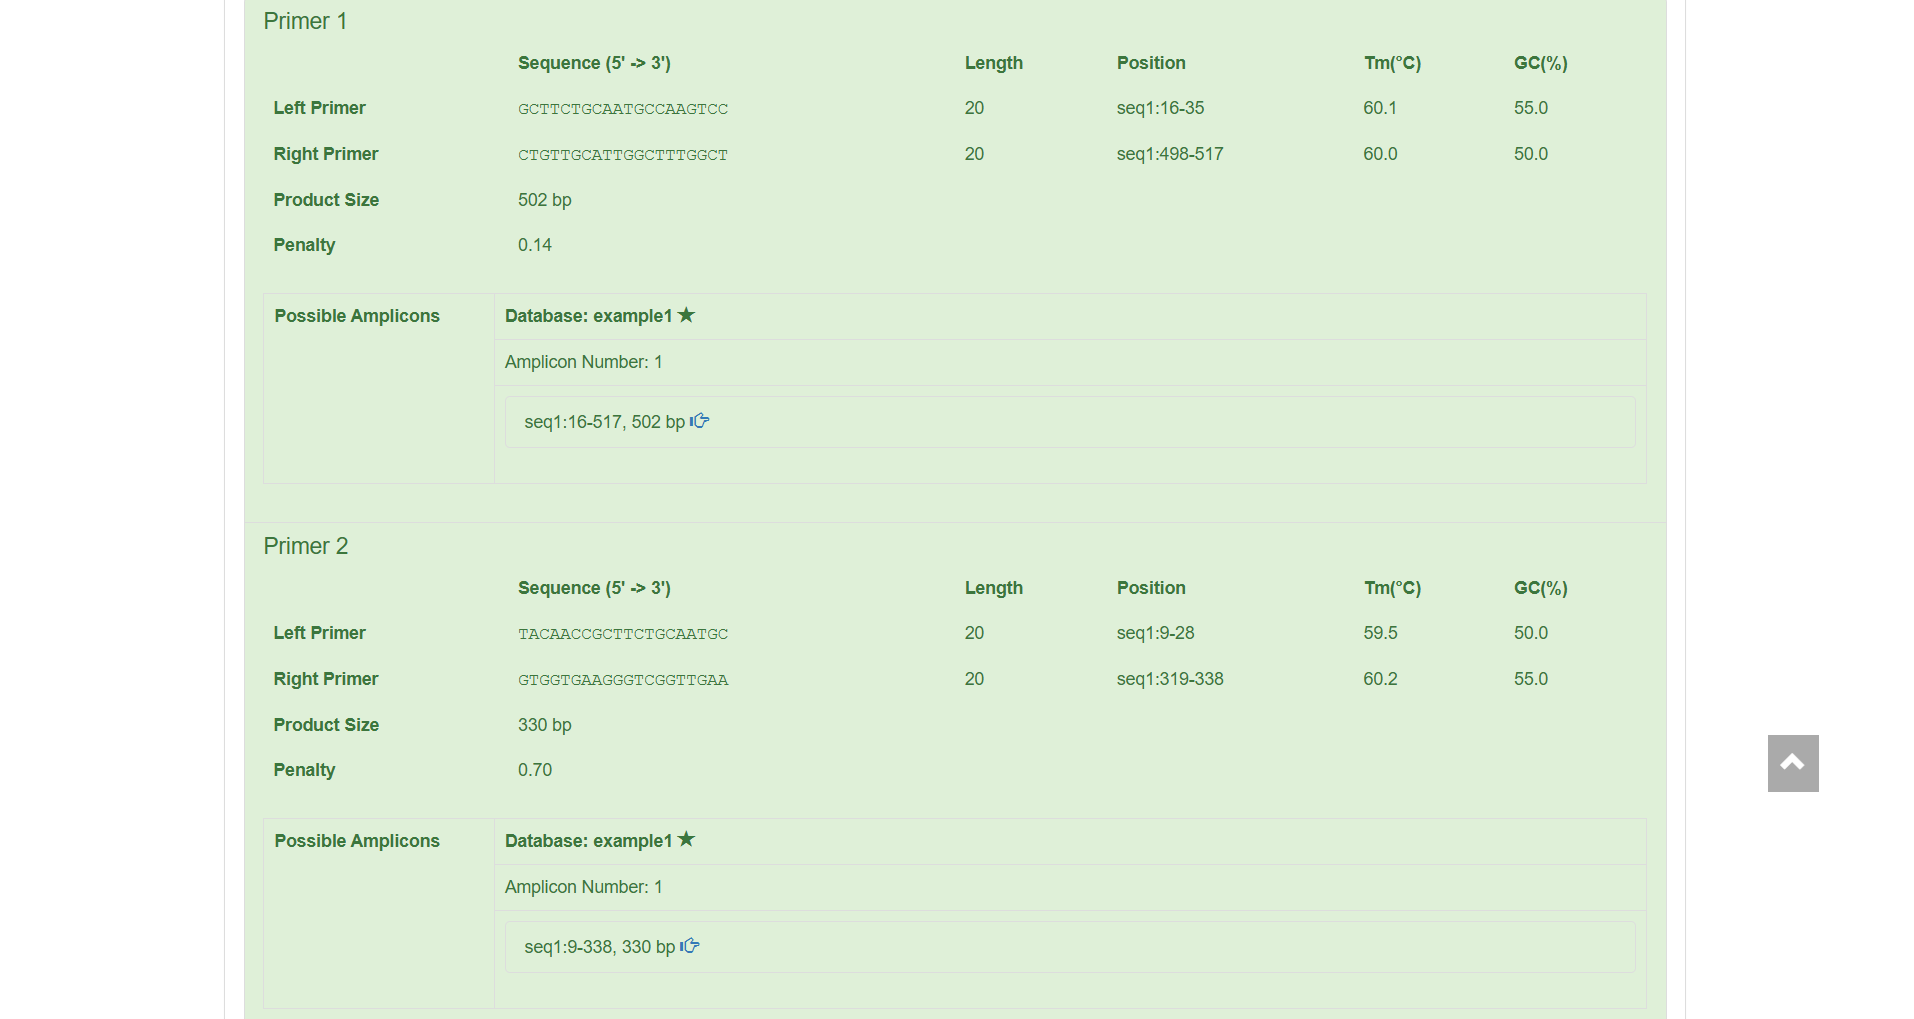
Figure 2.8: Primer Details Analysis result display.
2.2.2 Results of Design Only Mode
The blue horizontal line at the top represents the template sequence seq1, with scales indicating base positions (approximately 50 - 500 bp). Black arrows indicate the amplification range of different primer pairs.
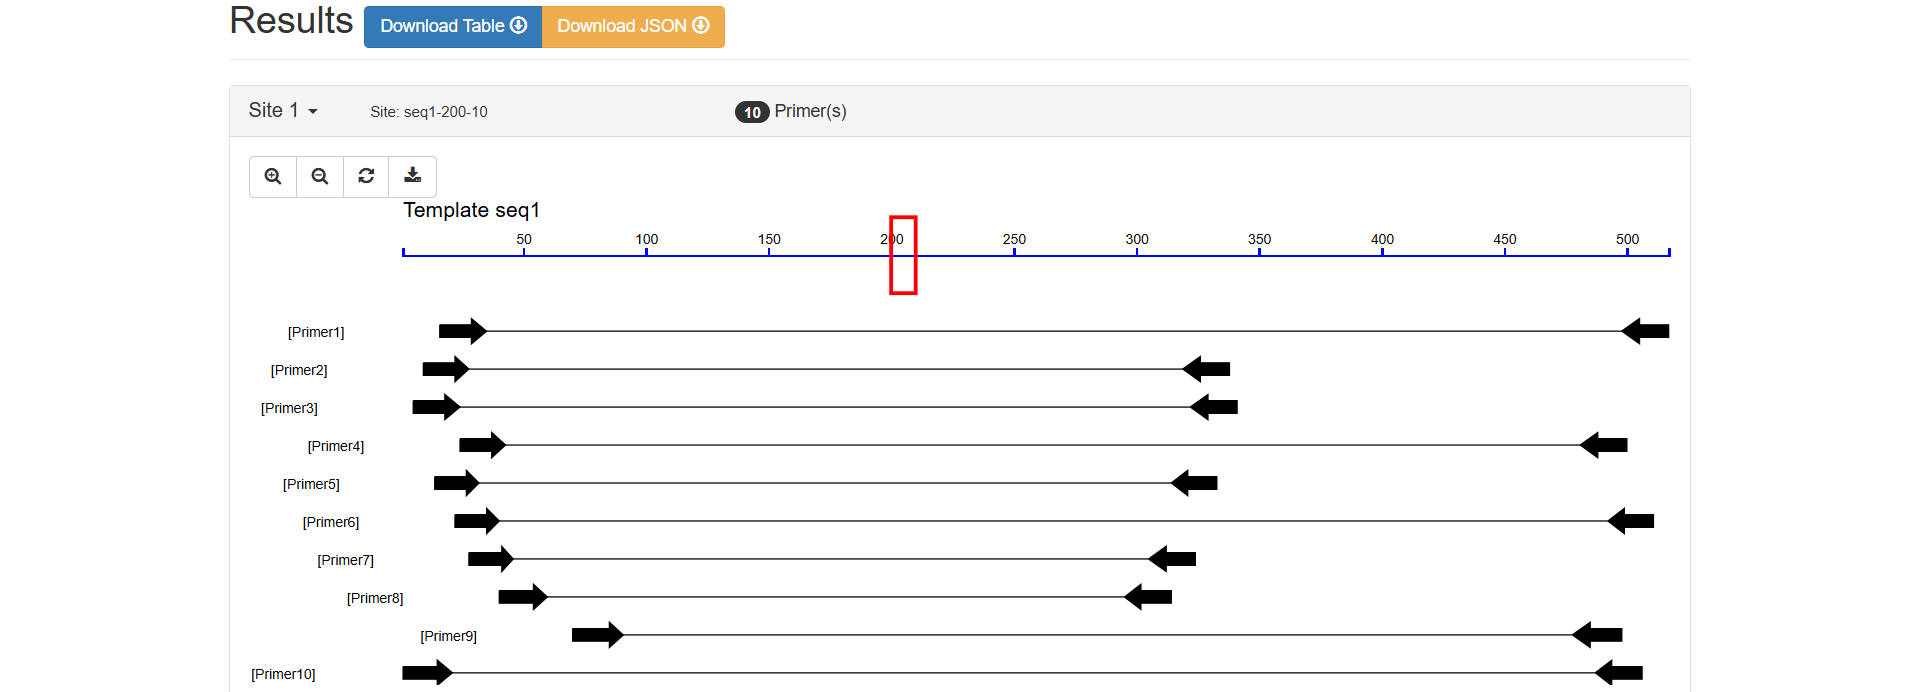
Figure 2.9: Visual Map Analysis result display.
Sequence (5’→3’): GCTTCTGCAATGCCAAGTCC
Length: 20 bp (within the conventional primer length range of 15 - 30 bp)
Position: Binds to positions 16 - 35 of seq1
Tm (Melting Temperature): 60.1℃
GC Content: 55.0% (within the optimal range of 40% - 60%, ensuring the stability of binding between the primer and the template)
Sequence (5’→3’): CTGTTGCATTGGCTTTGGCT
Length: 20 bp
Position: Binds to positions 498 - 517 of seq1
Tm: 60.0℃ (only 0.1℃ difference from the Tm of the forward primer, with good pairing, ensuring that the forward and reverse primers bind to the template simultaneously during PCR)
GC Content: 50.0%
502 bp (calculated from the start position of the forward primer (16) to the end position of the reverse primer (517): 517 - 16 + 1 = 502, consistent with expectations)
0.14 (A lower penalty value indicates higher overall primer quality. 0.14 is a low value, indicating that the primer performs excellently in parameters such as length, Tm, and GC content)
The specific content is not displayed in this area. If supplemented later, it can further determine whether the primer has non-specific amplification (i.e., whether it will amplify fragments outside the target).
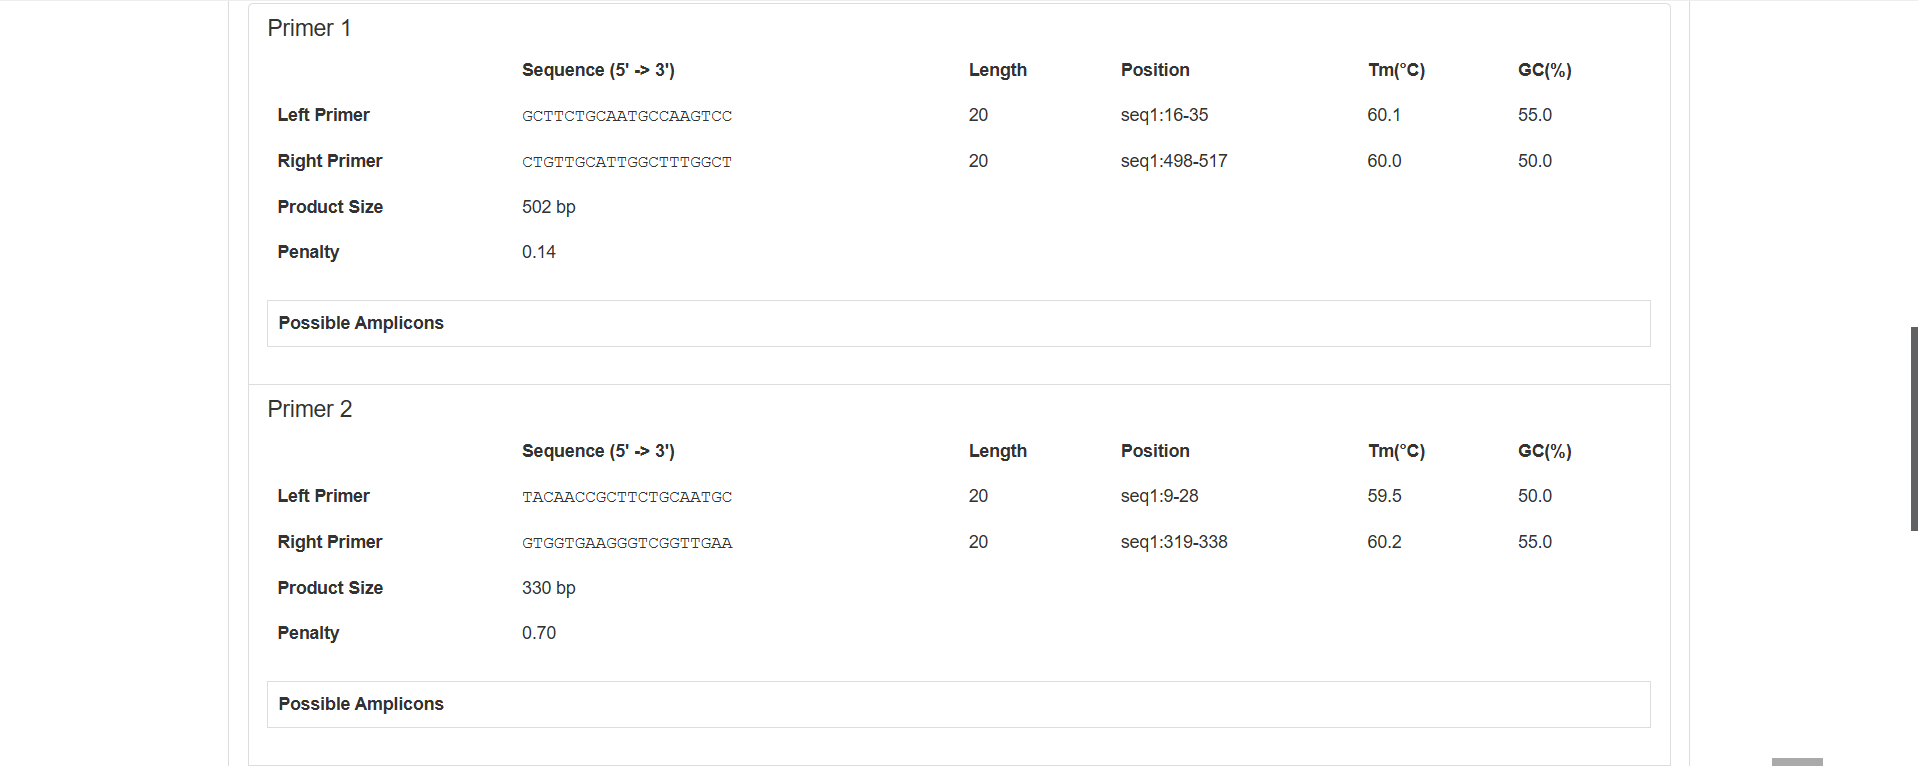
Figure 2.10: Primer Details Analysis result display.
2.2.3 Results of Check Only Mode
Sequence (5’→3’): CTTCTGCAATGCCAAGTCCAG
Length: 21 bp (within the conventional primer length range of 15 - 30 bp)
Tm (Melting Temperature): 54.0℃
GC Content: 52.4% (within the optimal range of 40% - 60%, ensuring the stability of binding between the primer and the template)
Sequence (5’→3’): GTGGTGAAGGTCGGTTGAA
Length: 20 bp
Tm: 54.3℃ (only 0.3℃ difference from the Tm of the forward primer, with good pairing, ensuring that the forward and reverse primers bind to the template simultaneously during PCR)
GC Content: 55.0%
Alignment is performed based on the example1 database.
Only 1, indicating that the primer pair can amplify only 1 target fragment in the reference database.
Amplicon Details: seq1:17-338, 322 bp, i.e., the primer pair binds to positions 17 - 338 of seq1, and the length of the amplified product is 322 bp (calculation: 338 - 17 + 1 = 322).
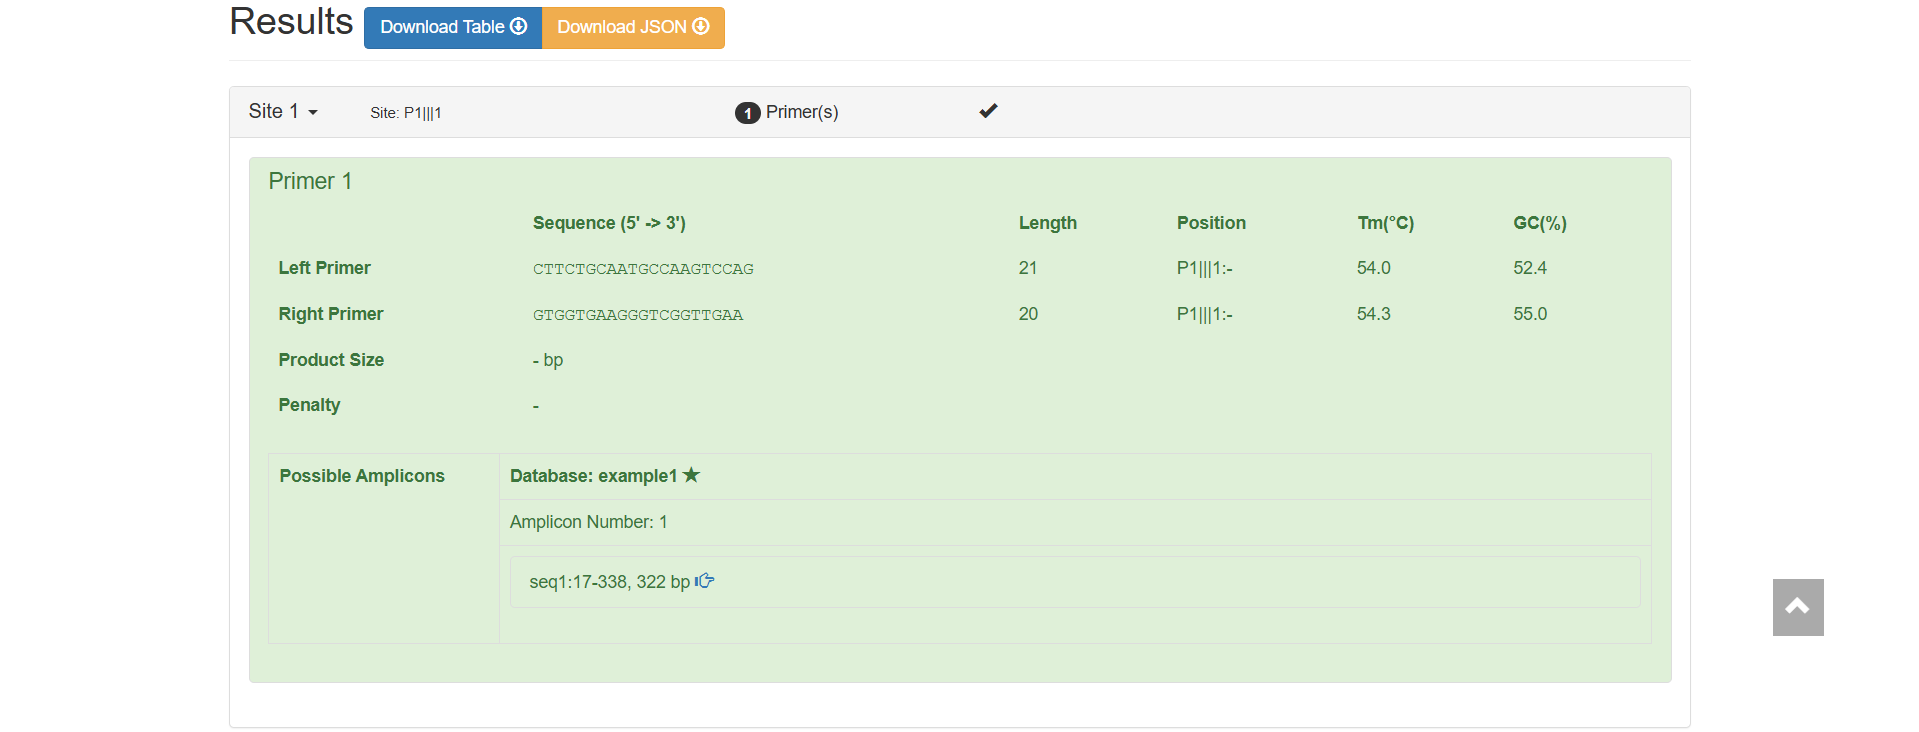
Figure 2.11: Primer Basic Information and Specificity Verification result display.