8 GO/KEGG enrichment analysis
This tool is a professional gene/protein functional enrichment analysis platform specifically designed for Eucalyptus species, focusing on the biological function annotation of Eucalyptus gene/protein sets. It deeply integrates Eucalyptus-specific KEGG pathway annotation, GO functional annotation, STRING protein-protein interaction network (Eucalyptus species-specific data), and PubMed-related literature association information. From multiple dimensions including metabolic pathways, biological processes, protein interaction neighbors, and literature reports, it rapidly mines the enrichment characteristics of target Eucalyptus gene/protein sets. Applicable to fields such as Eucalyptus molecular breeding, stress resistance mechanism research, lignin synthesis regulation, and essential oil metabolic pathway analysis, it assists researchers in efficiently deducing the potential functions and molecular mechanisms of Eucalyptus genes, providing precise support for Eucalyptus-related omics research.
8.1 Operation Demonstration
8.1.1 Enter Target Eucalyptus Protein IDs
In the left input box labeled "Protein IDs (space/comma separated)", enter the Eucalyptus protein IDs to be analyzed as follows:
example:
EUGRSUZ_H04045 EUGRSUZ_I00055 EUGRSUZ_I00628 EUGRSUZ_J02207 EUGRSUZ_J02208
EUGRSUZ_H04045,EUGRSUZ_I00055,EUGRSUZ_I00628,EUGRSUZ_J02207,EUGRSUZ_J02208
- Enter 1 ID: Automatically expands to 10 Eucalyptus-specific interacting factors;
- Enter ≥2 IDs: Expansion function is disabled, and the target gene set is analyzed directly.
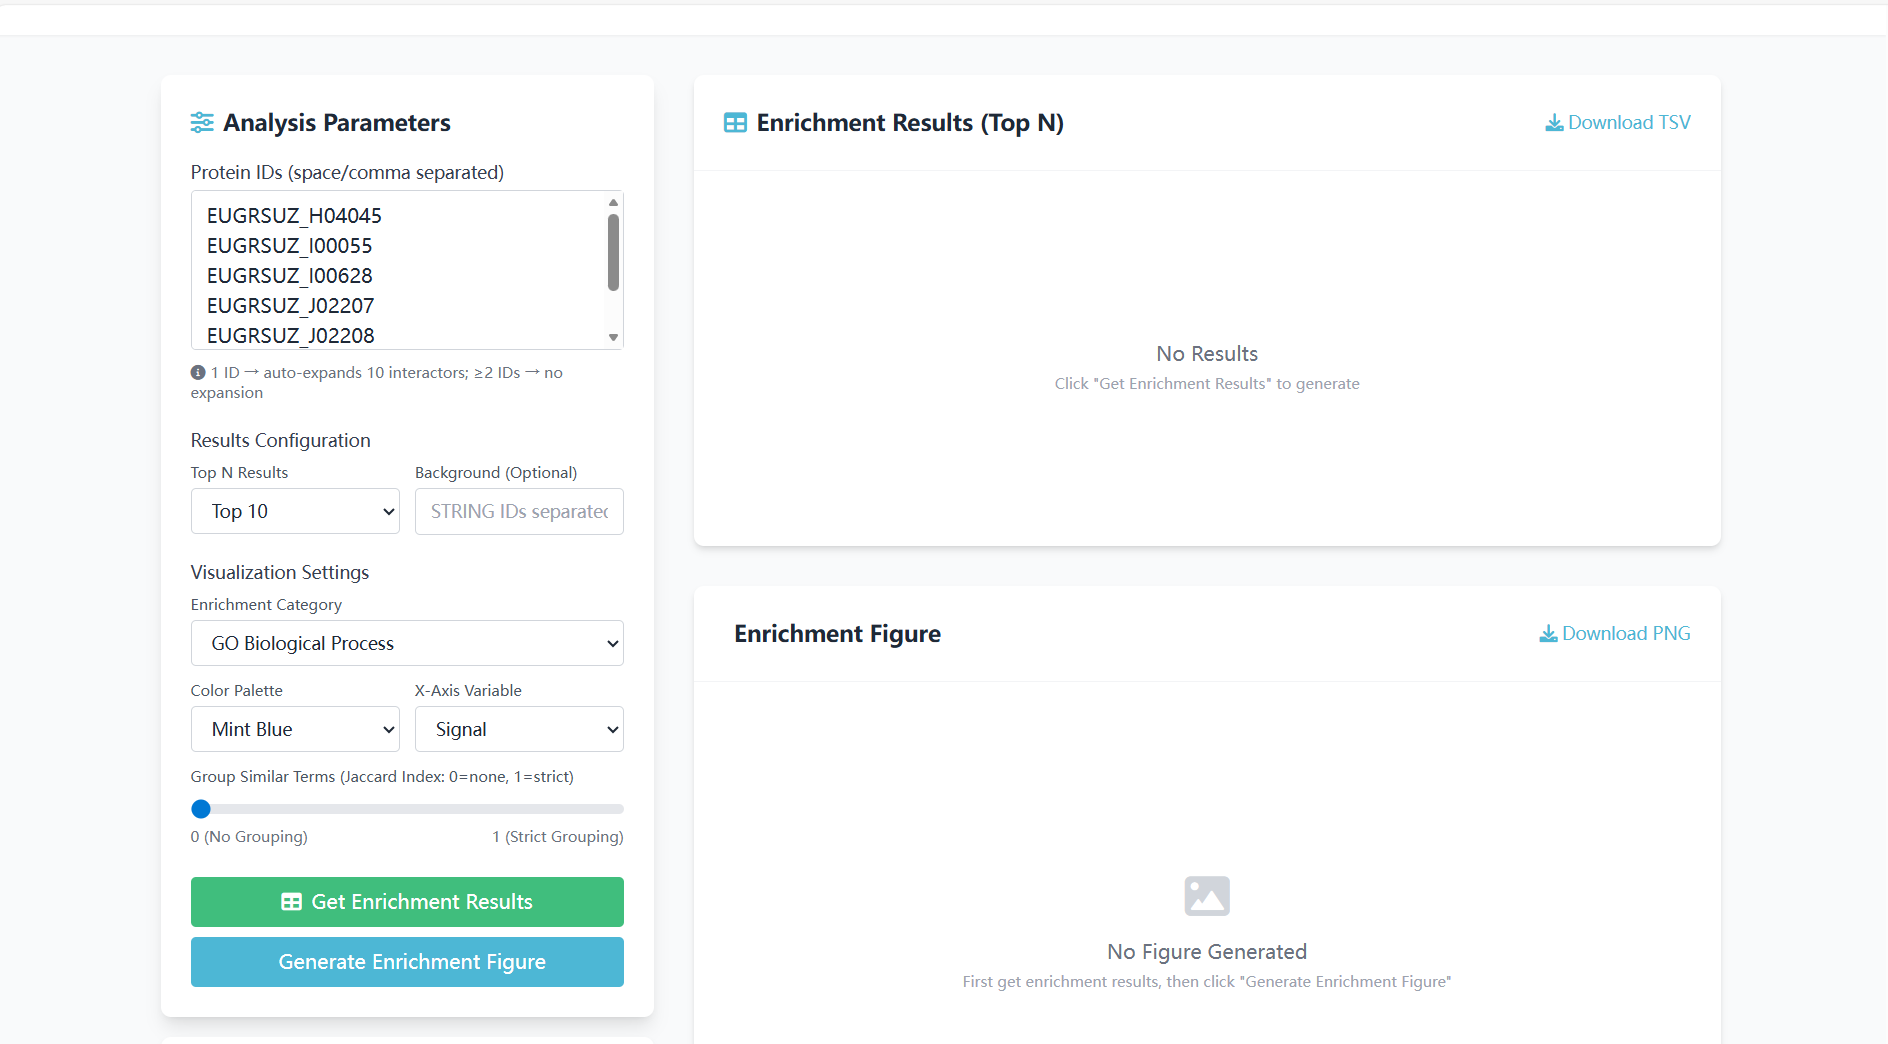
Figure 8.1: Screenshot of Eucalyptus protein ID input interface for GO/KEGG enrichment analysis
8.1.2 Configure Result Parameters
Set the parameters for the enrichment analysis results as follows:
Top N Results:
- Description: Select the number of most significantly enriched terms to return;
- Example: "Top 10" means returning the 10 enriched terms with the smallest FDR among all Eucalyptus categories.
Background (Optional):
- Description: Optionally enter the STRING IDs of the Eucalyptus background gene set (separated by spaces);
- Purpose: Define the Eucalyptus whole-genome background, avoiding enrichment bias caused by mismatched background gene sets and significantly improving the accuracy of Eucalyptus-specific analysis;Note: This field is non-mandatory.
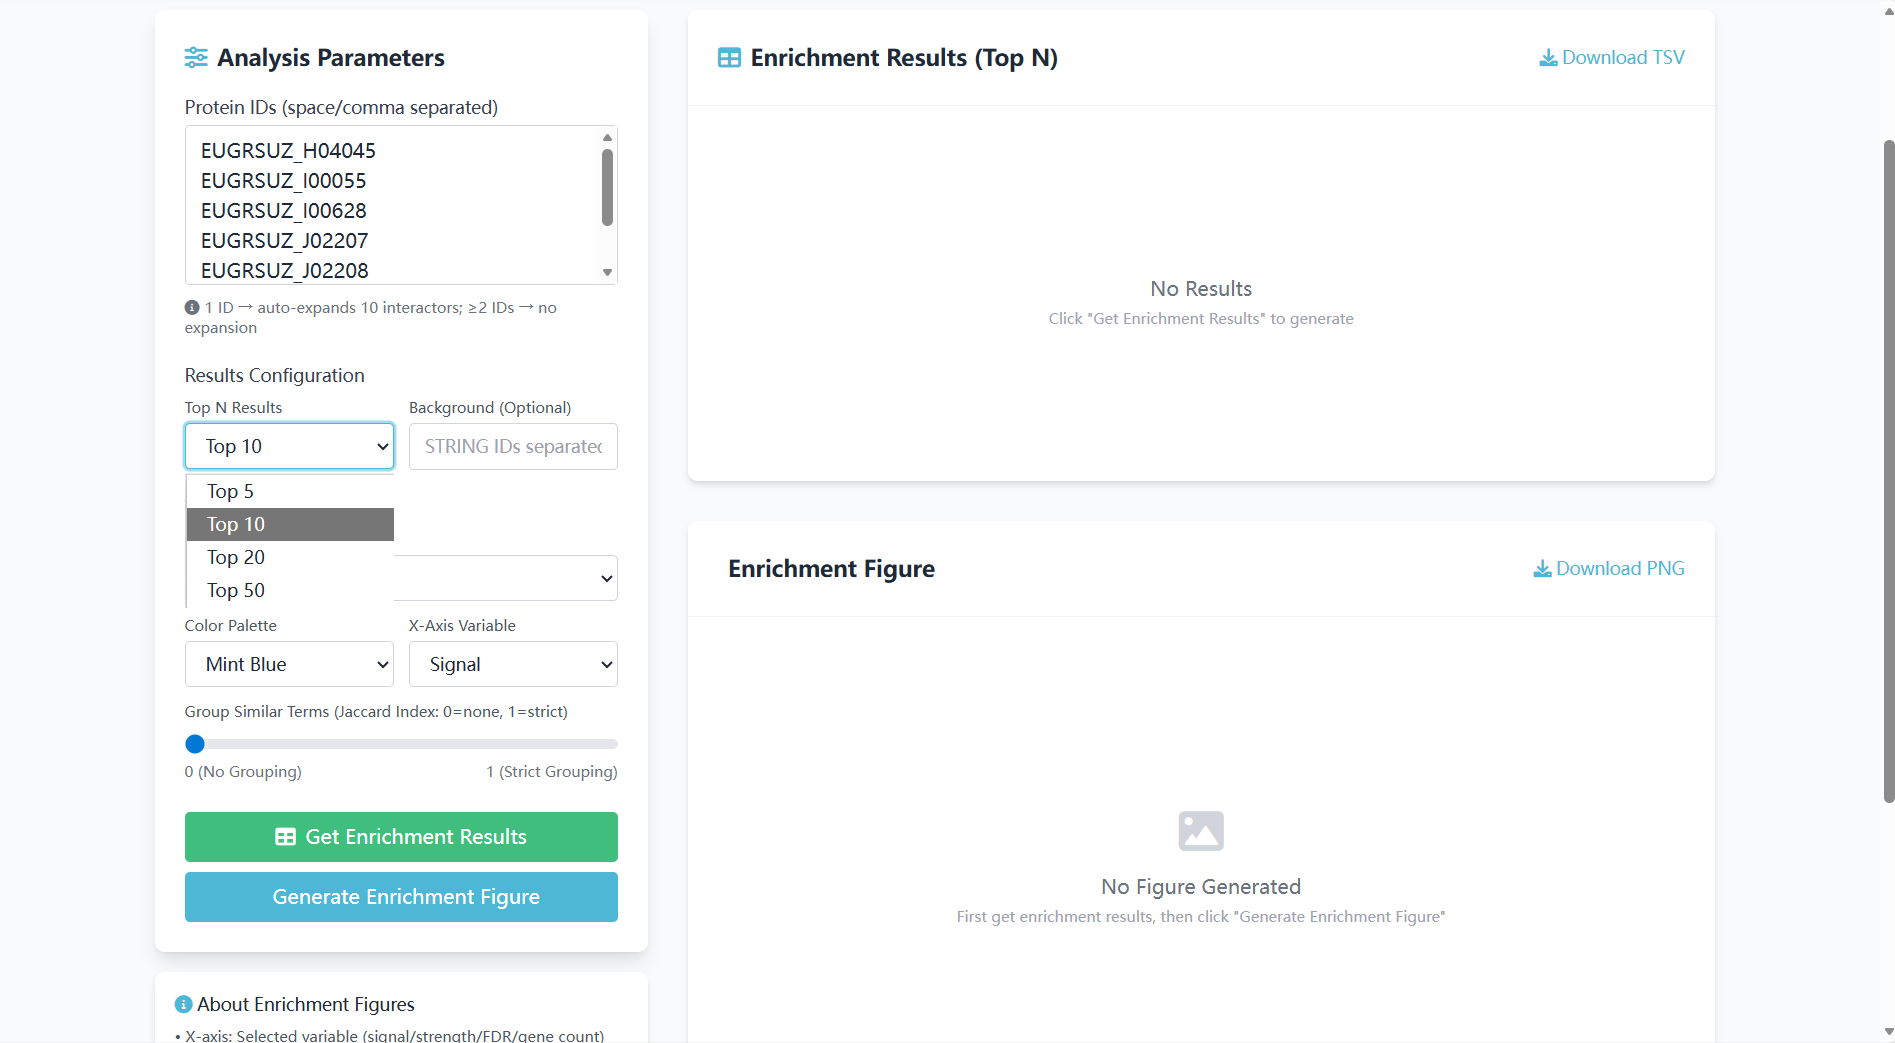
Figure 8.2: Screenshot of result parameter configuration interface for GO/KEGG enrichment analysis
8.1.3 Set Visualization Parameters
Configure the display parameters for the enrichment visualization chart as follows:
Enrichment Category:
- Description: Select the Eucalyptus-specific biological dimension for enrichment analysis;
- Supported categories: KEGG Pathways (Eucalyptus metabolic pathways, e.g., Eucalyptus essential oil synthesis pathway, lignin metabolic pathway), GO Biological Process (Eucalyptus Gene Ontology - Biological Process), GO Molecular Function (Molecular Function), GO Cellular Component (Cellular Component);
- Example: Selecting "KEGG Pathways" focuses on the enrichment analysis of Eucalyptus metabolic pathways.
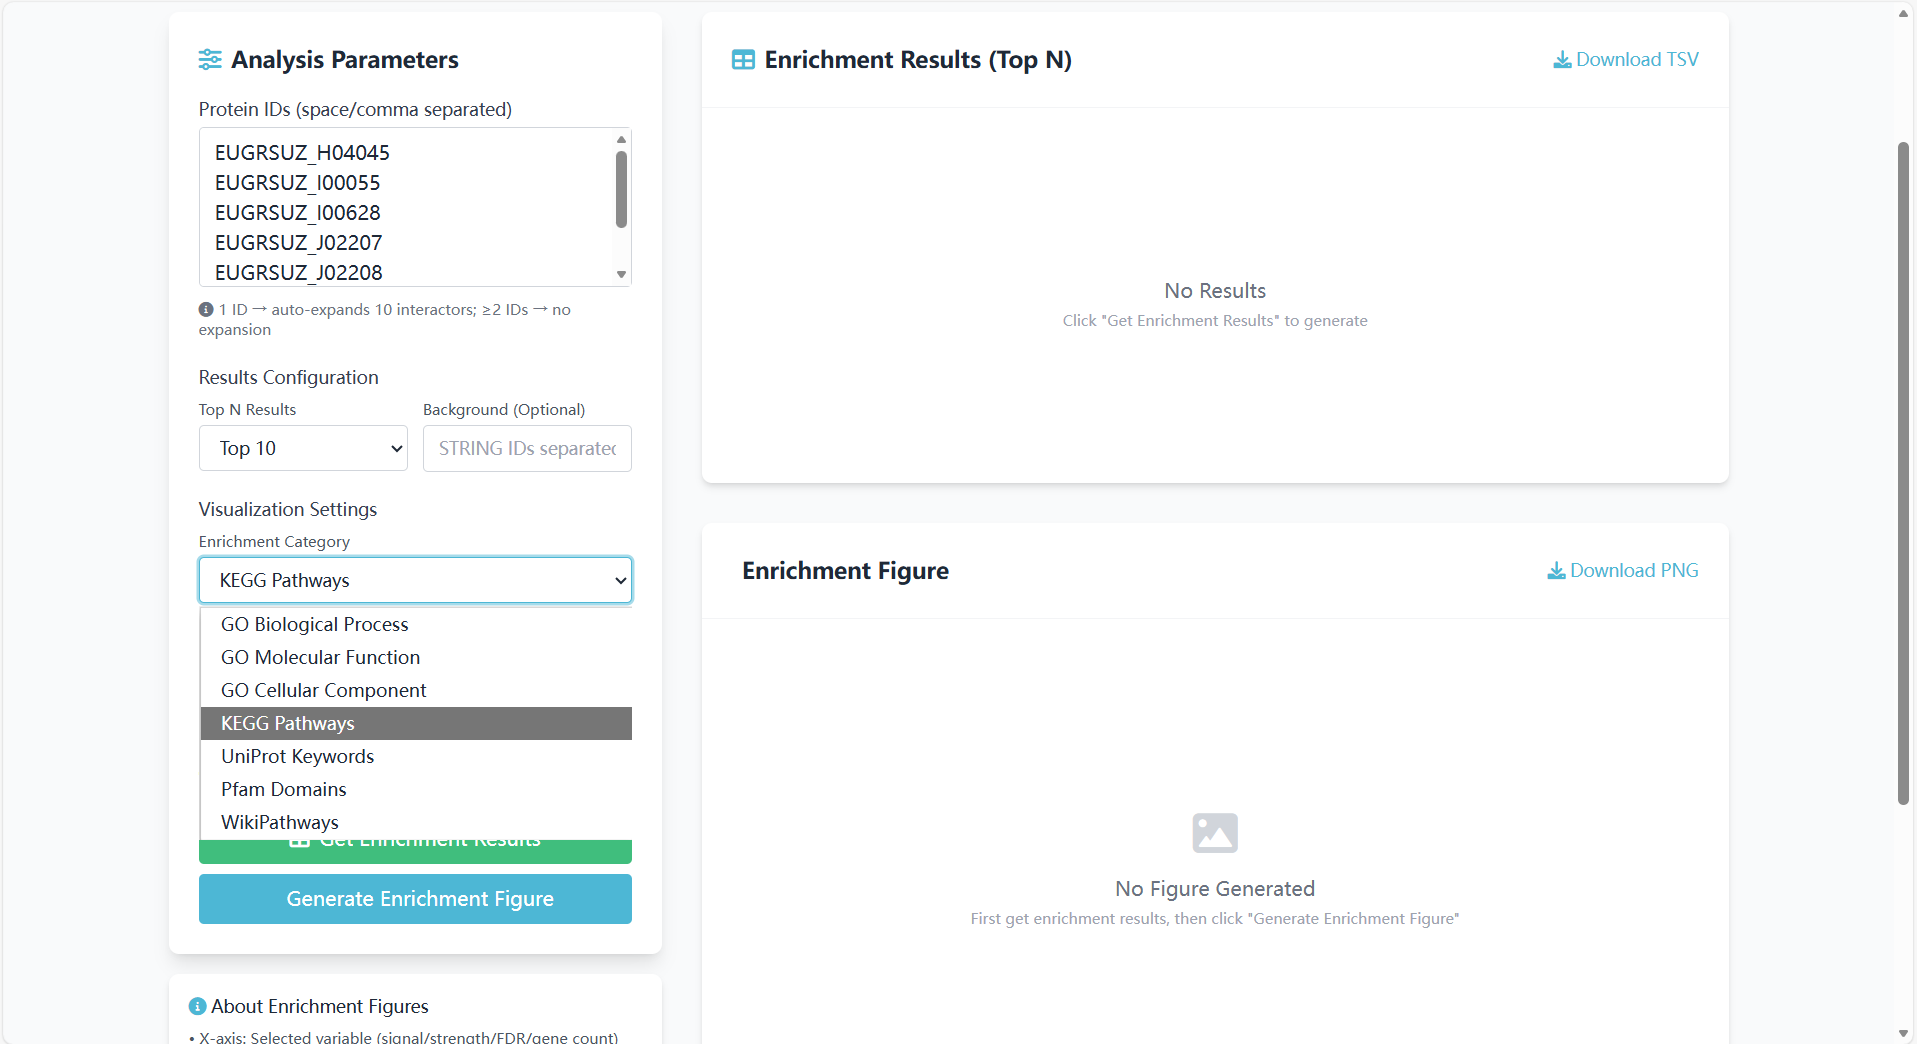
Figure 8.3: Screenshot of enrichment category selection interface for GO/KEGG enrichment analysis
Color Palette:
- Description: Select the color scheme for visualization charts;
- Example: "Peach Purple", "Mint Blue", etc.;
- Purpose: Distinguish the FDR and gene count of Eucalyptus enrichment results.
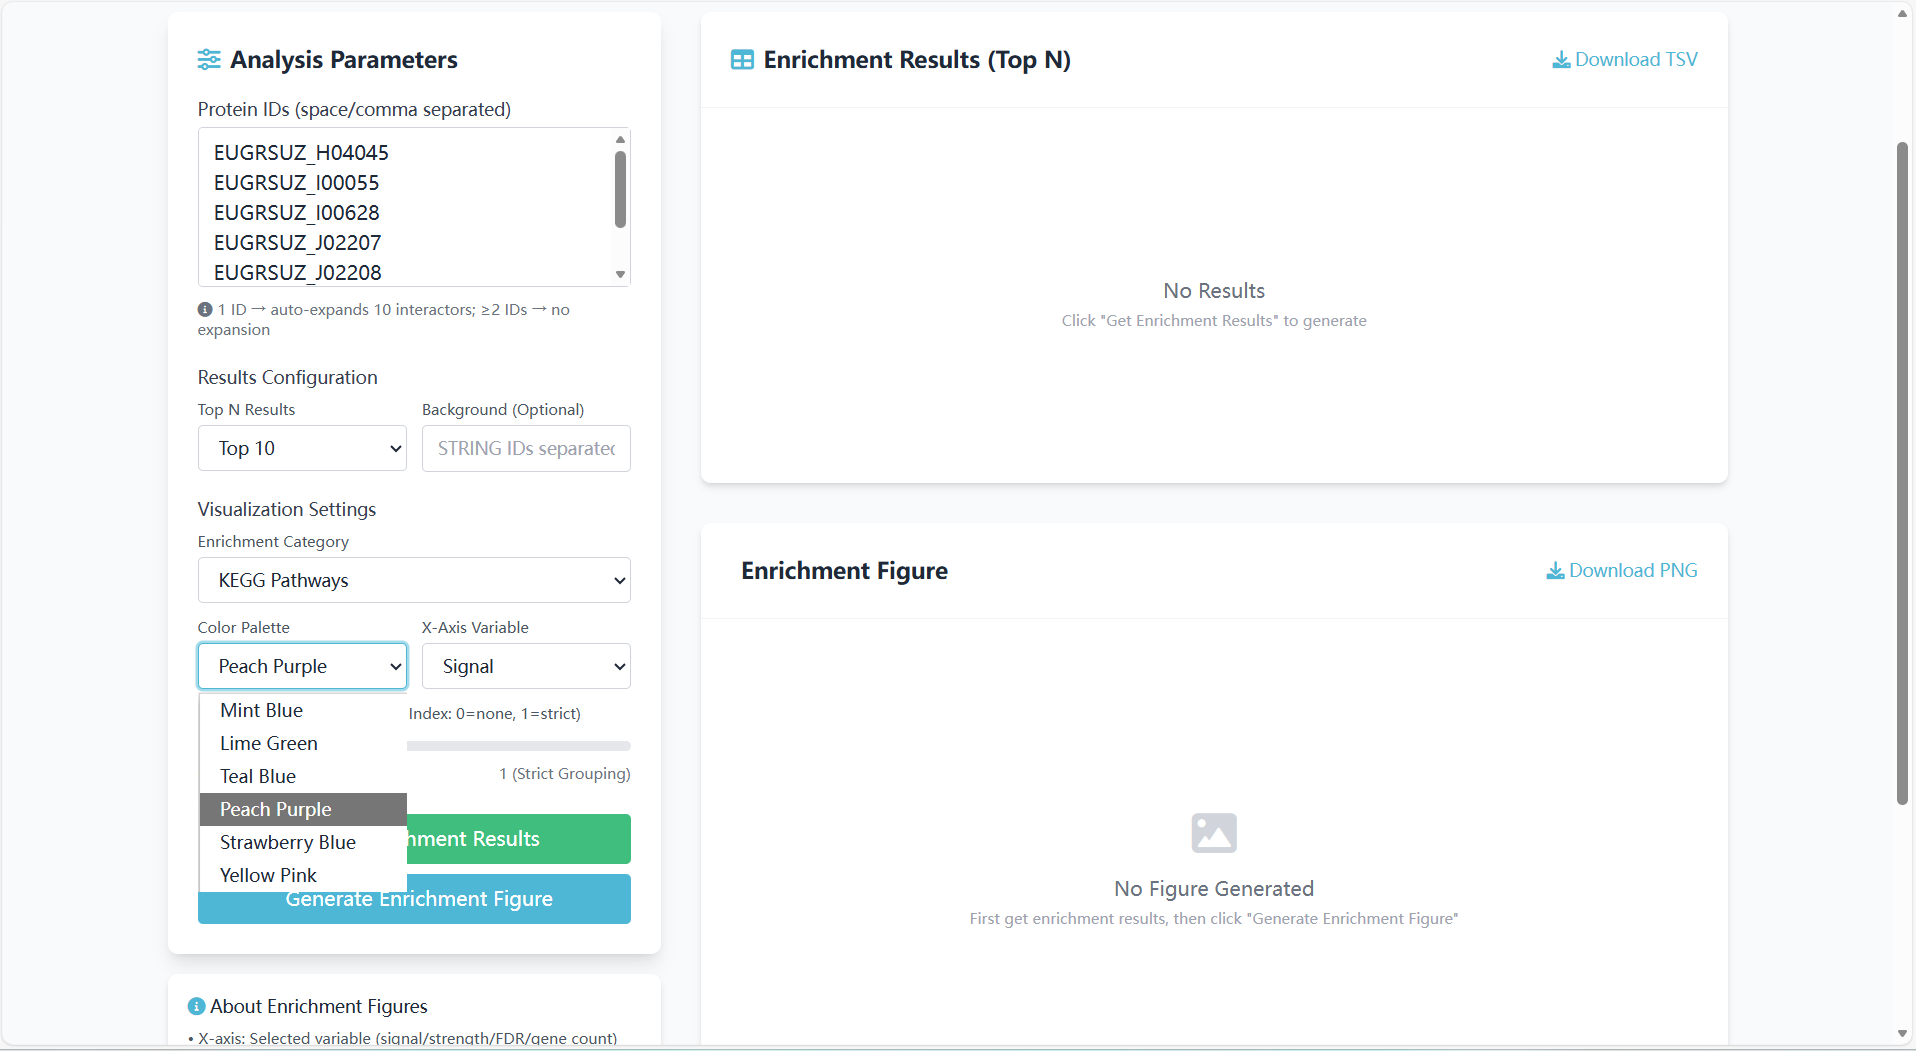
Figure 8.4: Screenshot of color palette selection interface for GO/KEGG enrichment analysis
X-Axis Variable:
- Description: Select the quantitative indicator for the X-axis of the enrichment plot;
- Optional options: "Signal", "Strength", "FDR", "Gene Count";
- Example: Selecting "Strength" sorts pathways based on the intensity of Eucalyptus enrichment signals.
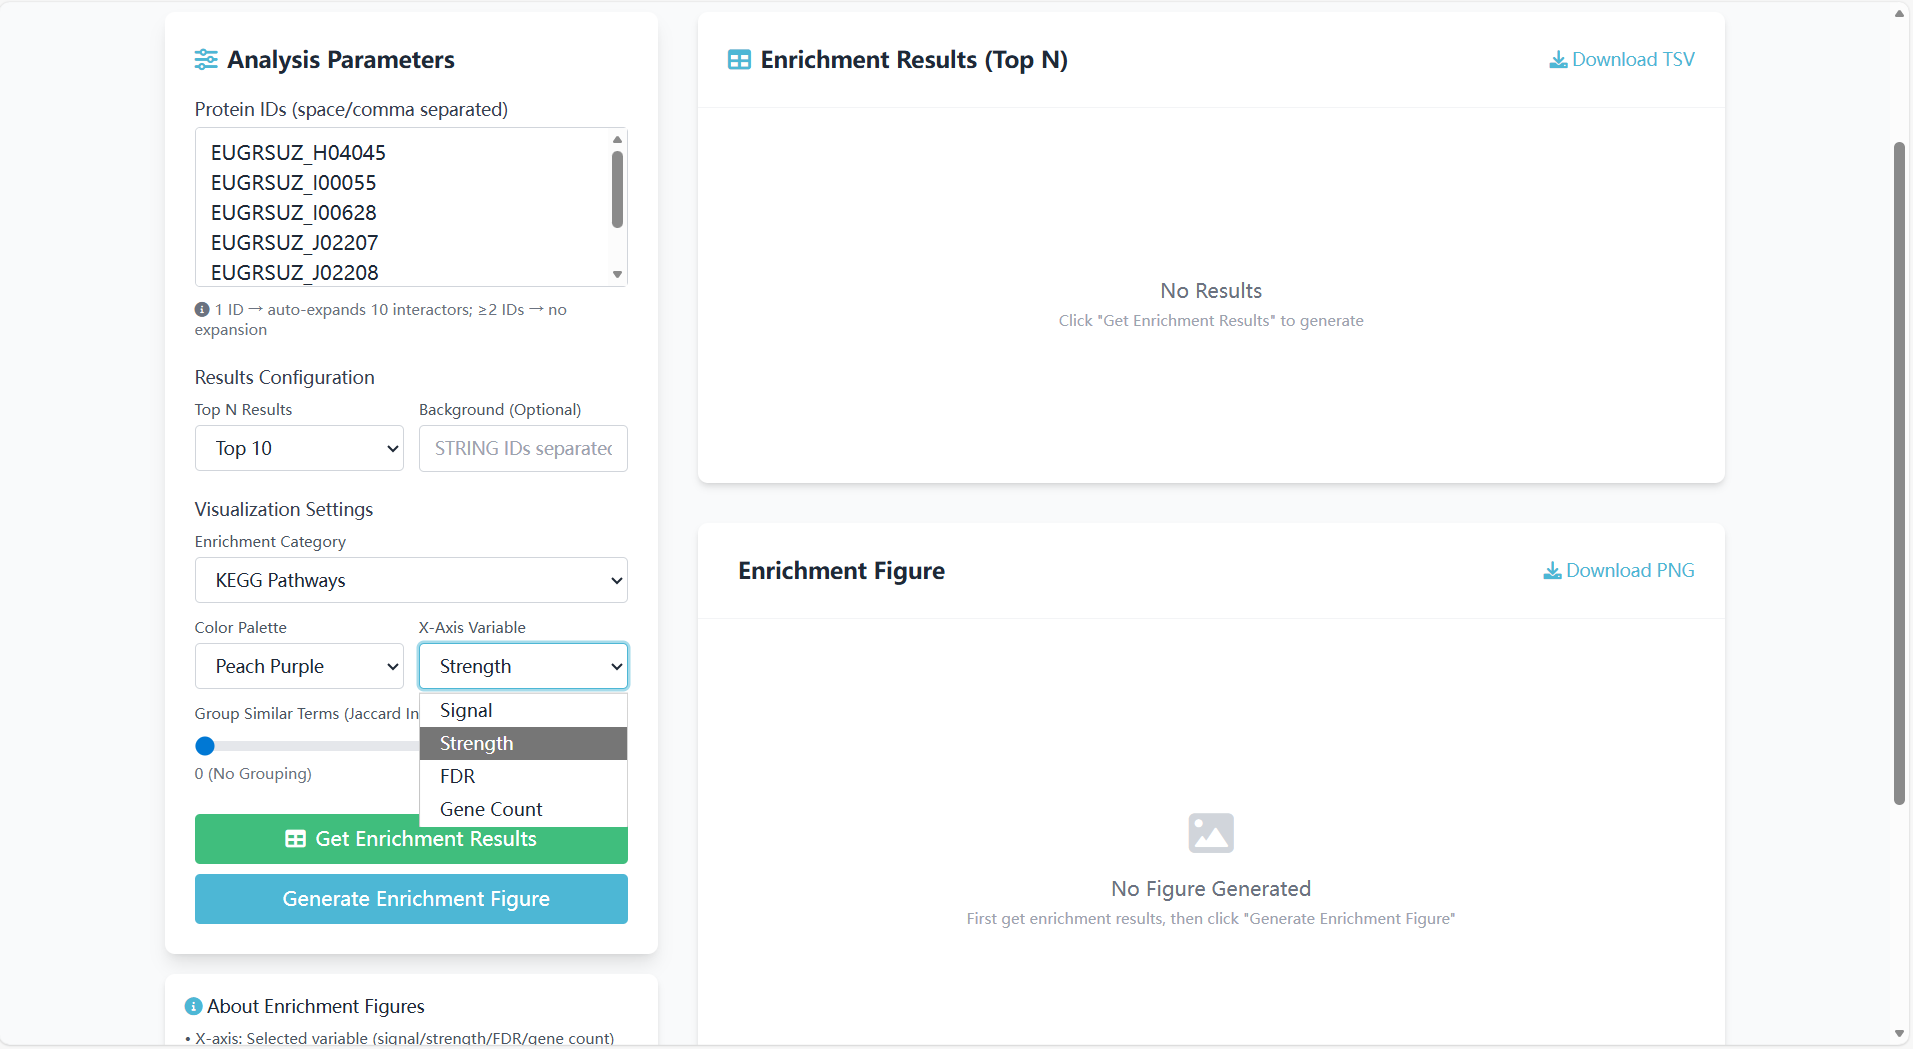
Figure 8.5: Screenshot of X-axis variable selection interface for GO/KEGG enrichment analysis
Group Similar Terms:
- Description: Group similar Eucalyptus enriched terms using the Jaccard Index;
- Slider range: 0 ("No Grouping") to 1 ("Strict Grouping");
- Default value: 0.
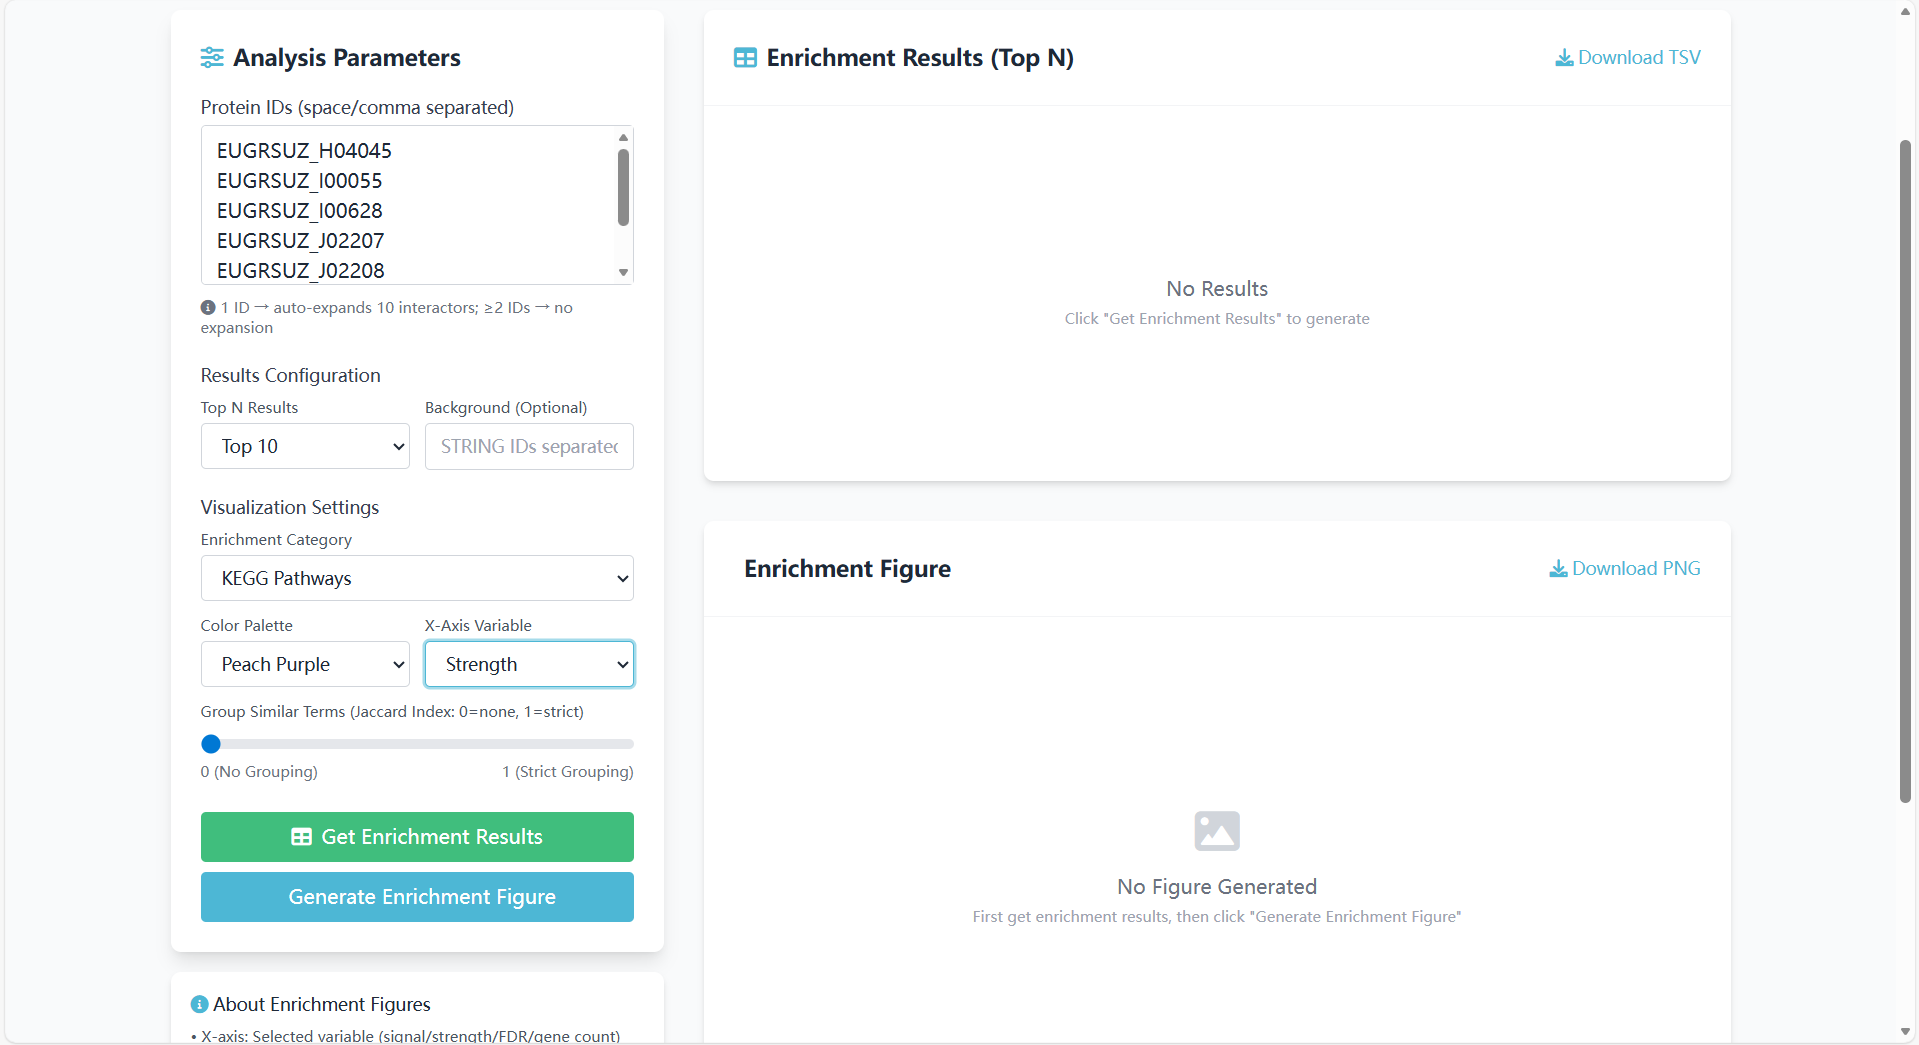
Figure 8.6: Screenshot of similar terms grouping interface for GO/KEGG enrichment analysis <
8.2 Result Analysis
Enrichment Results Table
The table contains 5 columns of core information, focusing on Eucalyptus-specific interpretation:
Enrichment Visualization Figure
A "bubble chart" is used to intuitively display the Eucalyptus KEGG pathway enrichment results. The interpretation of visual elements is as follows:
Supported Downloads
Formats: TSV, PNG
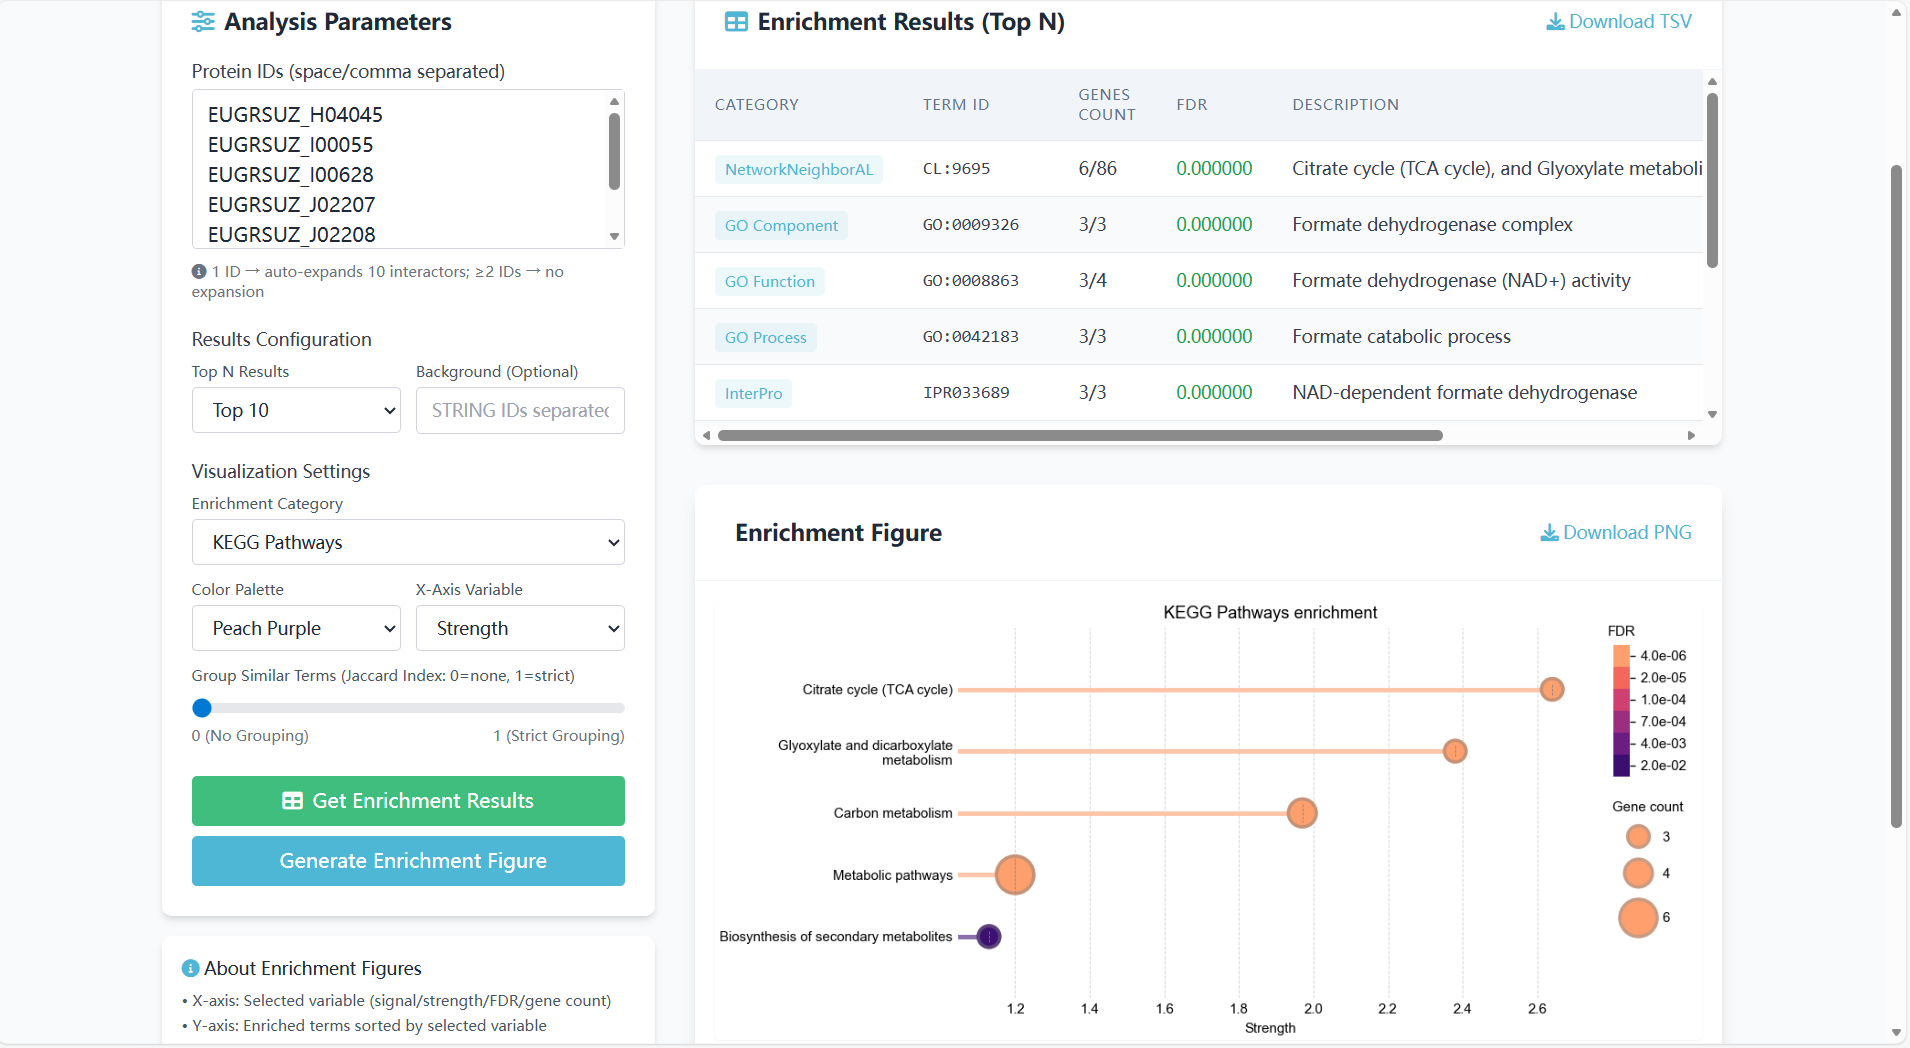
Figure 8.7: Screenshot of GO/KEGG enrichment analysis results (table + visualization)