5 Gene expression
This platform is a specialized tool for querying and visualizing Gene expression data of Eucalyptus across multi-species and multi-scenarios. It integrates transcriptome sequencing data of Eucalyptus (such as Eucalyptus grandis, E. camaldulensis, E. globulus, etc.) under conditions including tissue development and stress responses (cold, boron, salt, nitrogen, etc.). Through multiple visualization methods (bar chart, pie chart, line chart, heatmap, radar chart, polar area chart, etc.), complex gene expression data is converted into intuitive graphs. This helps users quickly explore the expression patterns of Eucalyptus genes in different tissues, developmental stages, and stress conditions. The platform also supports downloading of data tables and SVG vector graphics, meeting the dual needs of scientific research analysis and result presentation, and greatly reducing the technical threshold for Eucalyptus gene function research.
5.1 Operation Demonstration
5.1.1 Select Dataset
In the "Select the query table" dropdown menu, choose the target Eucalyptus dataset. The platform supports multiple Eucalyptus species and experimental types, such as:
eucalyptus_grandis_specific_tissues_development.
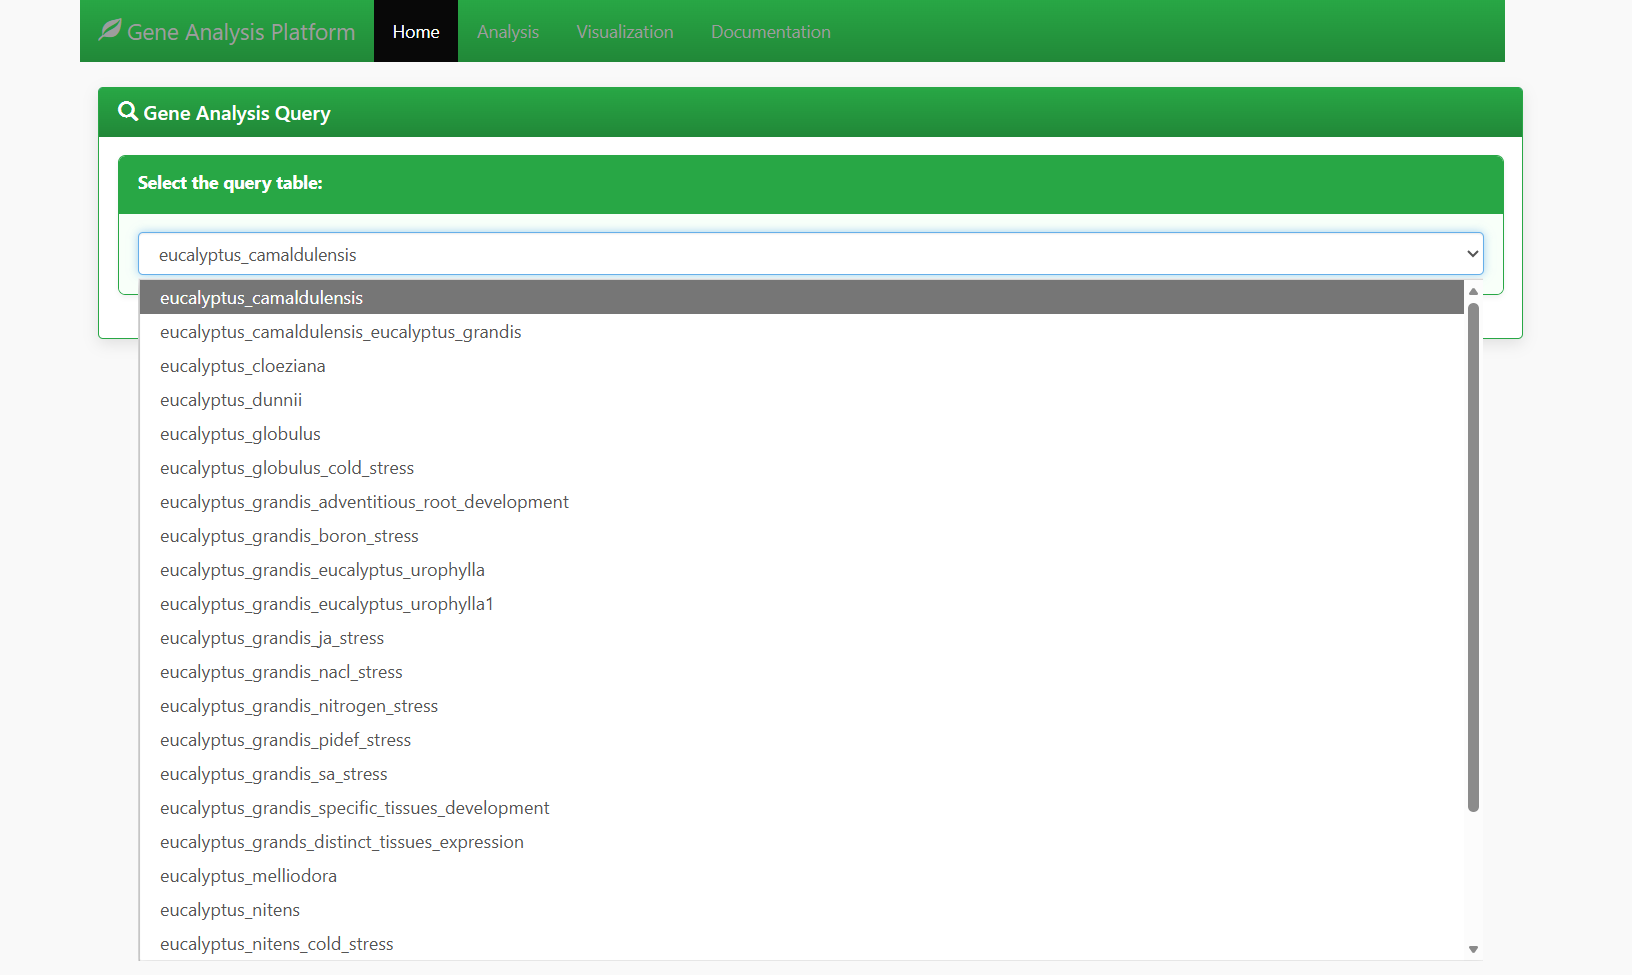
Figure 5.1: Screenshot of Eucalyptus dataset selection interface for Gene expression
In the "Select the columns to display" section, check the sample types to be analyzed (e.g., tissues, developmental stages, stress treatment groups). Examples include:
- xylem_6month (xylem of 6-month-old seedlings)
- phloem_3y_plant (phloem of 3-year-old plants)
- flower_3y_plant (flowers of 3-year-old plants)
- lateral_branch_3y_plant (lateral branches of 3-year-old plants)
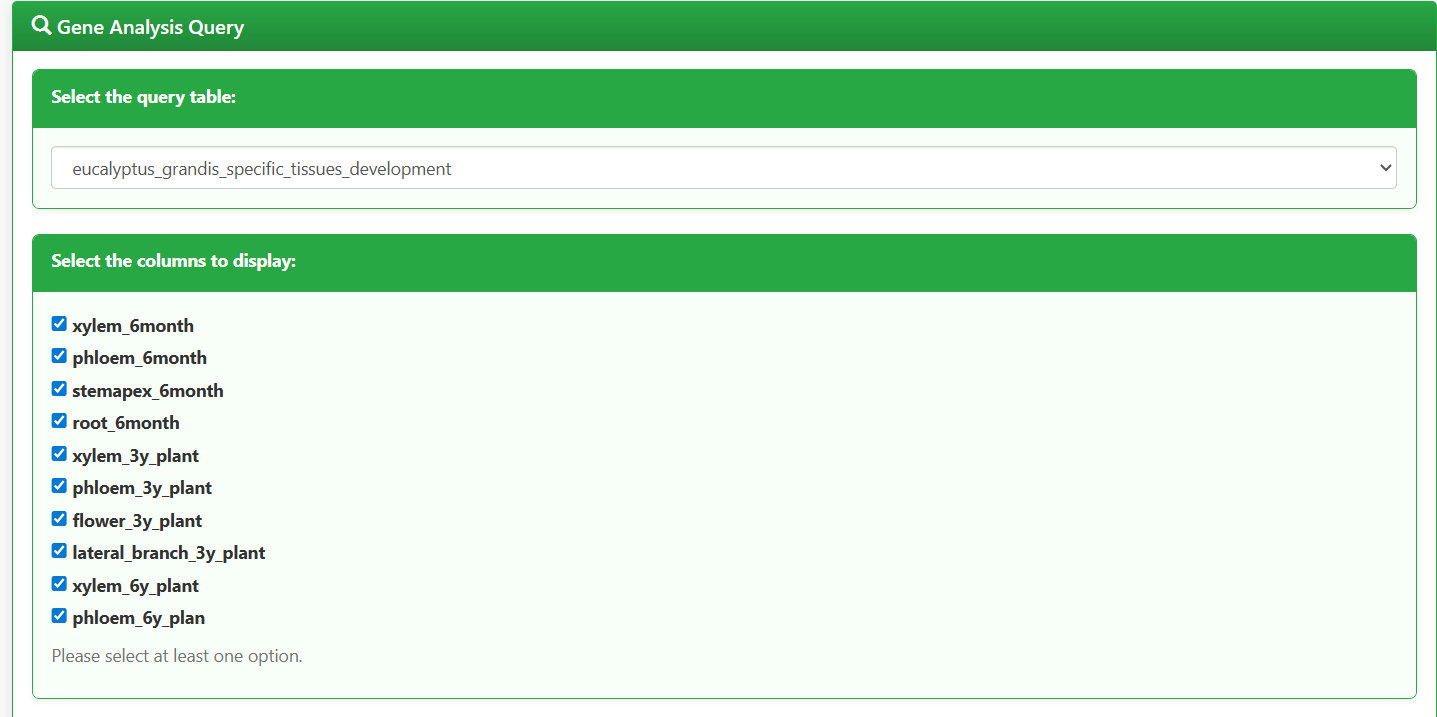
Figure 5.2: Screenshot of Eucalyptus sample type selection interface for Gene expression
5.1.2 Enter Gene IDs, Select Visualization Charts, and Generate Analysis
In the "Enter Geneid value" input box, enter the target Eucalyptus gene IDs (supports multiple IDs separated by English commas, Chinese commas, or spaces). Example:
LOC104414170 LOC104414171 LOC104414172 LOC104414173 LOC104414174 LOC104414175
In the "Select the type of visualization chart" section, check the required chart types (supports combined selection of bar chart, pie chart, line chart, heatmap chart, radar chart, and polarArea chart). If no chart type is selected, no visualization will be displayed.
Click the "Generate Analysis" button. The platform will automatically generate the gene expression data table and corresponding visualization charts.
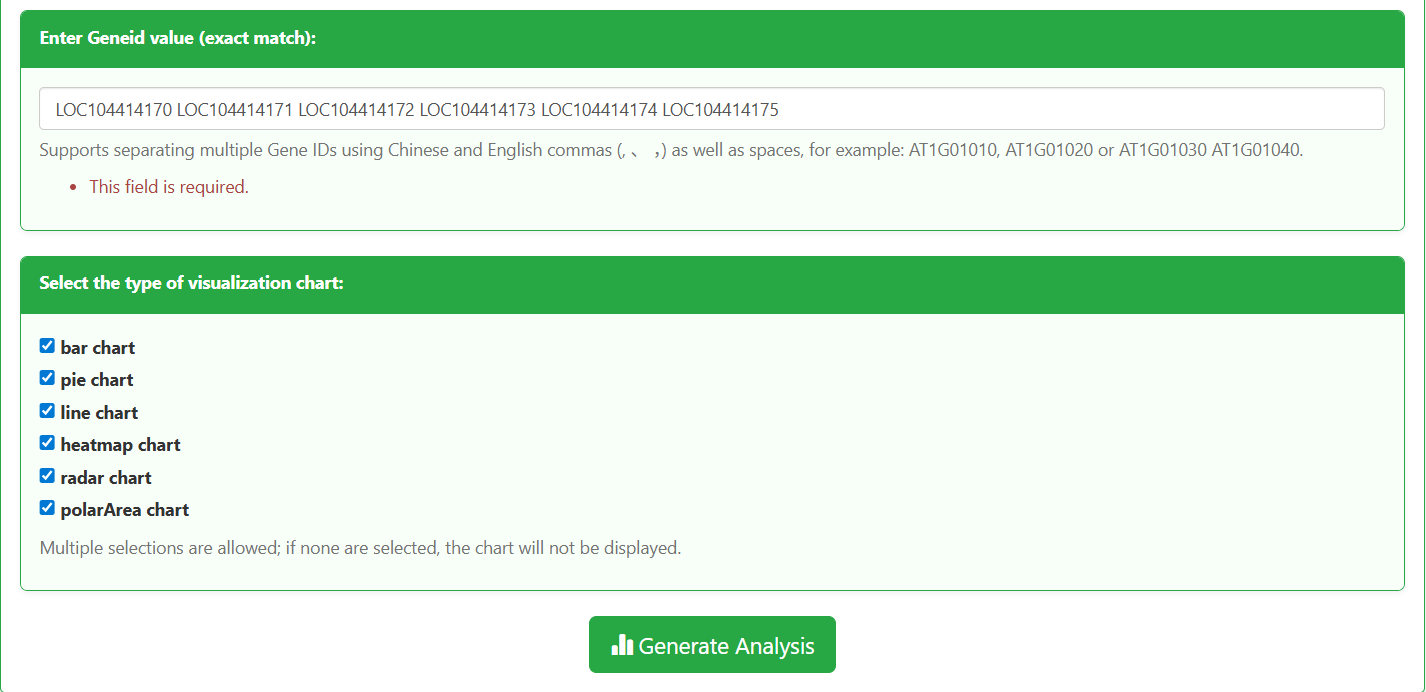
Figure 5.3: Screenshot of gene ID input and visualization chart selection interface for Gene expression
5.1.3 Supported Downloads
Data & Chart Download Options
5.2 Result Analysis
5.2.1 Raw Data Table of Eucalyptus Gene Expression
The raw expression data table follows a "gene × sample" matrix structure, with core information as follows:
- Rows: Each row corresponds to one Eucalyptus target gene (identified by Gene ID, e.g., LOC104414170).
- Columns: Each column corresponds to one sample type (e.g., xylem_6month, phloem_3y_plant), with clear labels of tissue/organ and developmental stage.
- Values: The numerical values in the table represent the expression activity of genes in the corresponding samples (calculated as FPKM/RPKM). Higher values indicate more active gene expression.
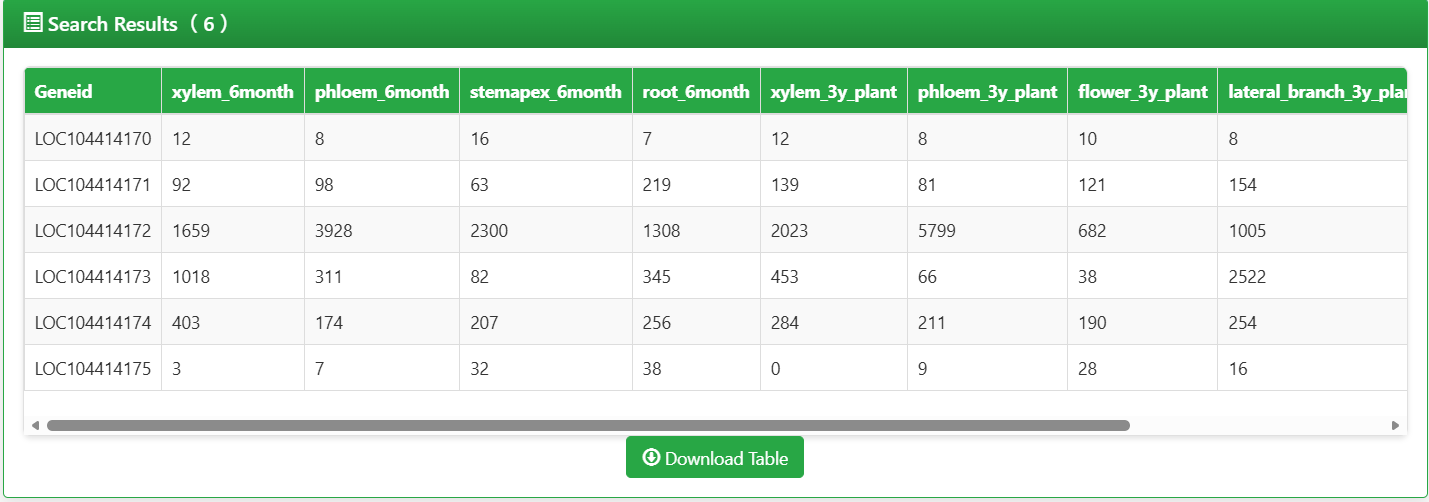
Figure 5.4: Screenshot of Eucalyptus Gene expression raw data table
5.2.2 Interpretation of Visualization Charts
Gene Expression Bar Chart
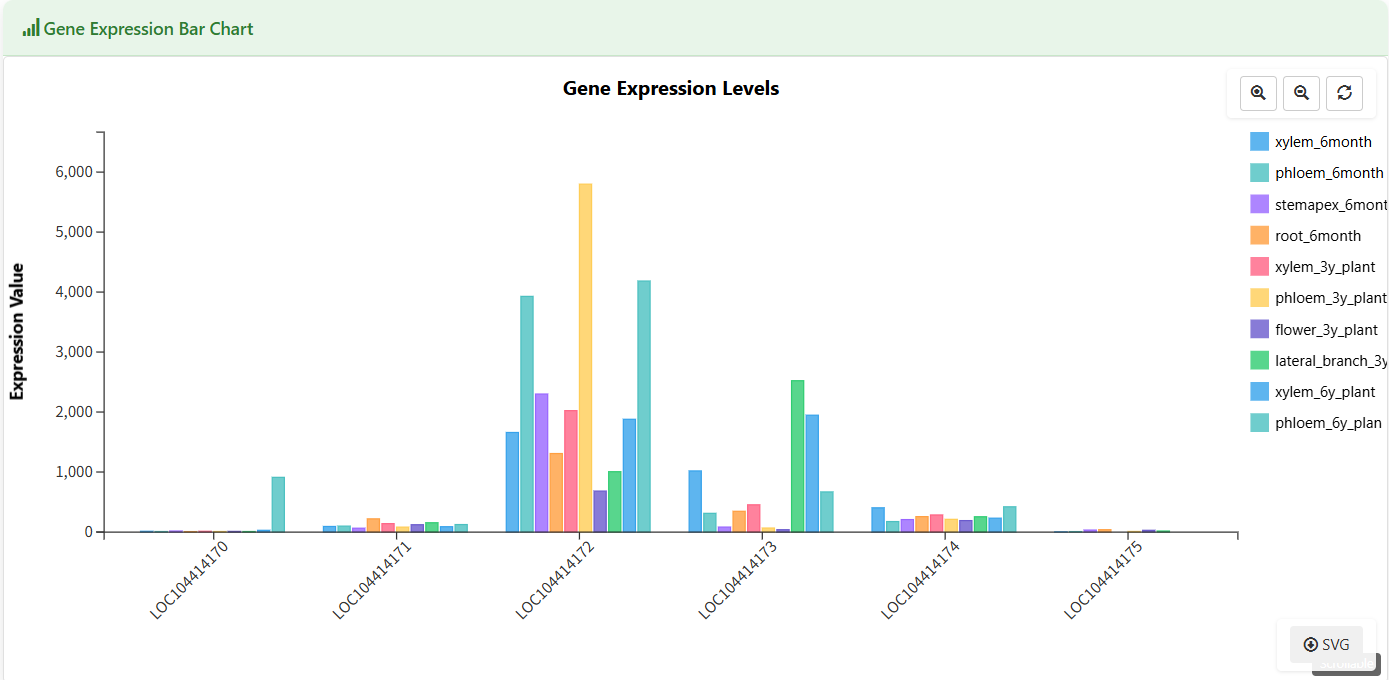
Figure 5.5: Screenshot of Eucalyptus Gene expression bar chart
Gene Distribution Pie Chart
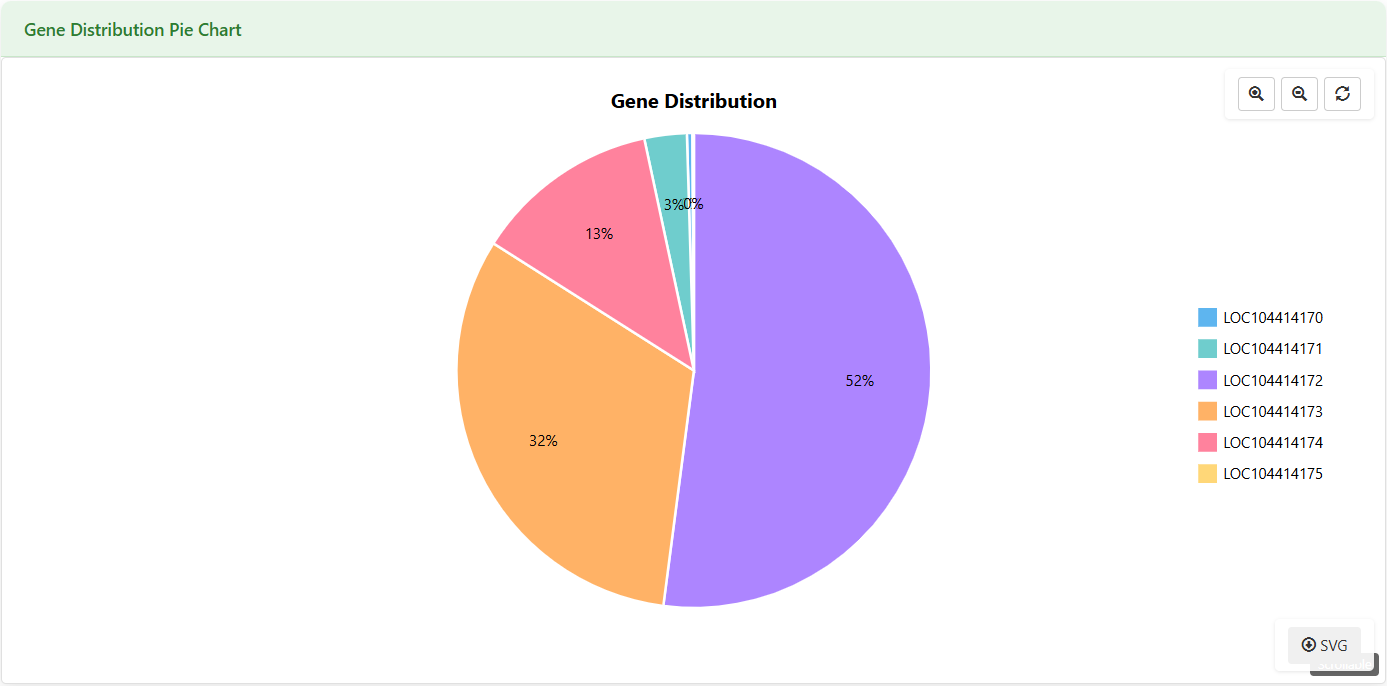
Figure 5.6: Screenshot of Eucalyptus Gene expression pie chart
Expression Trend Line Chart
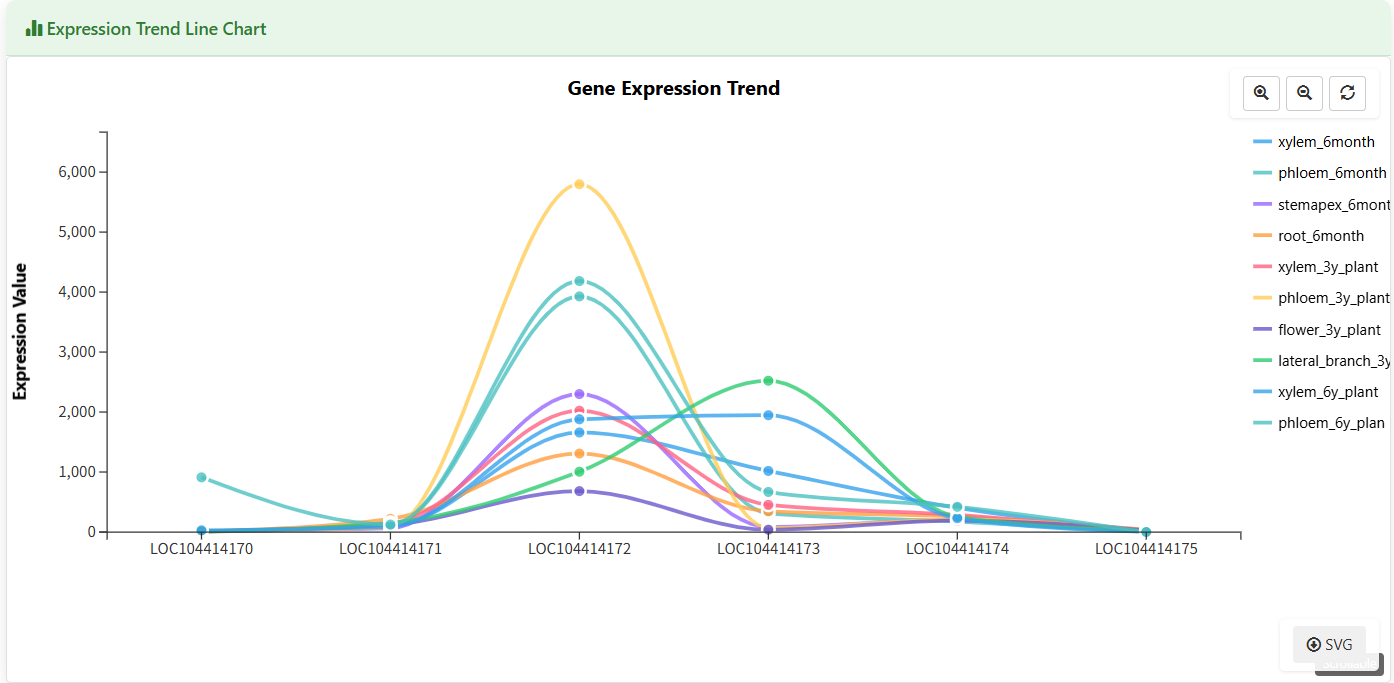
Figure 5.7: Screenshot of Eucalyptus Gene expression trend line chart
Gene Expression Heatmap
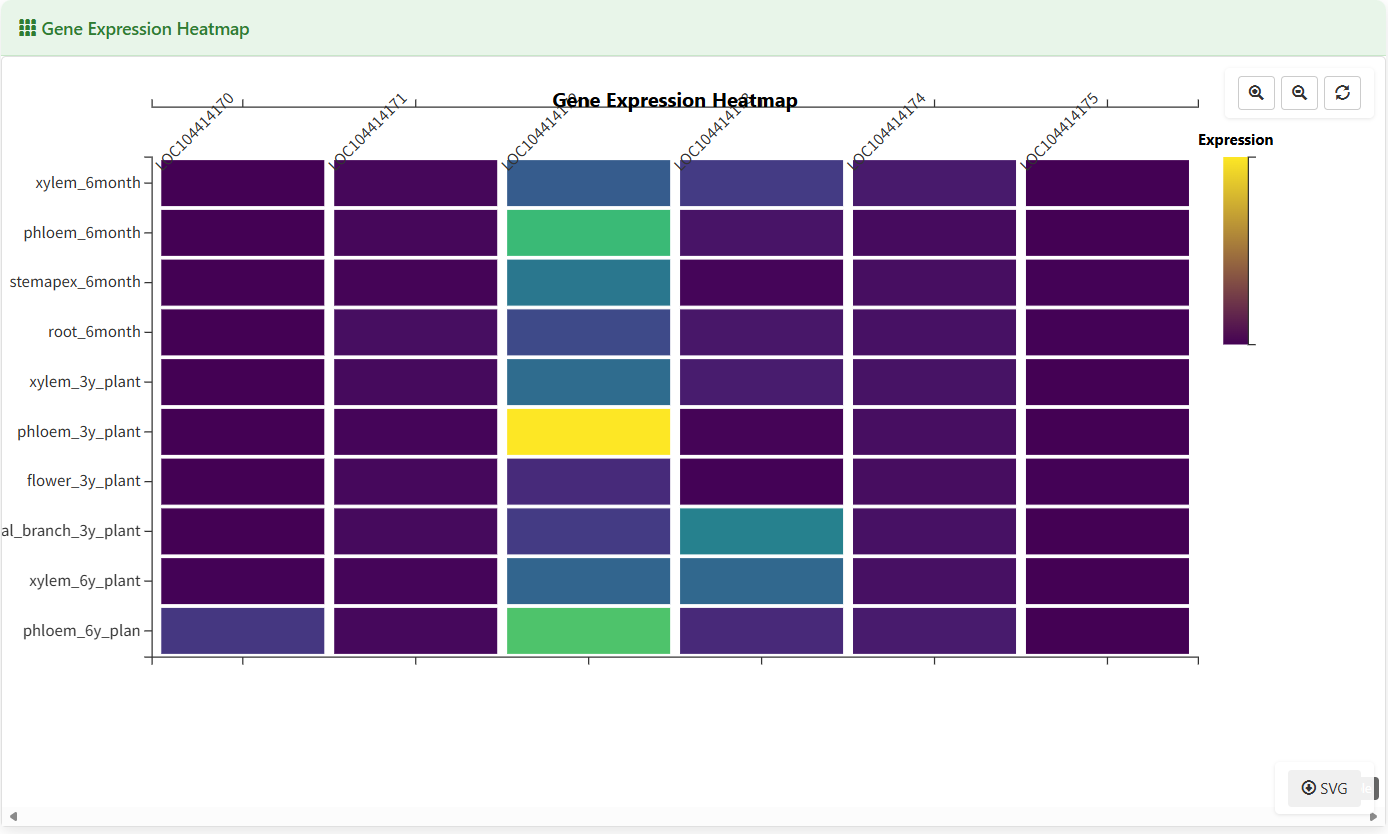
Figure 5.8: Screenshot of Eucalyptus Gene expression heatmap
Gene Feature Radar Chart
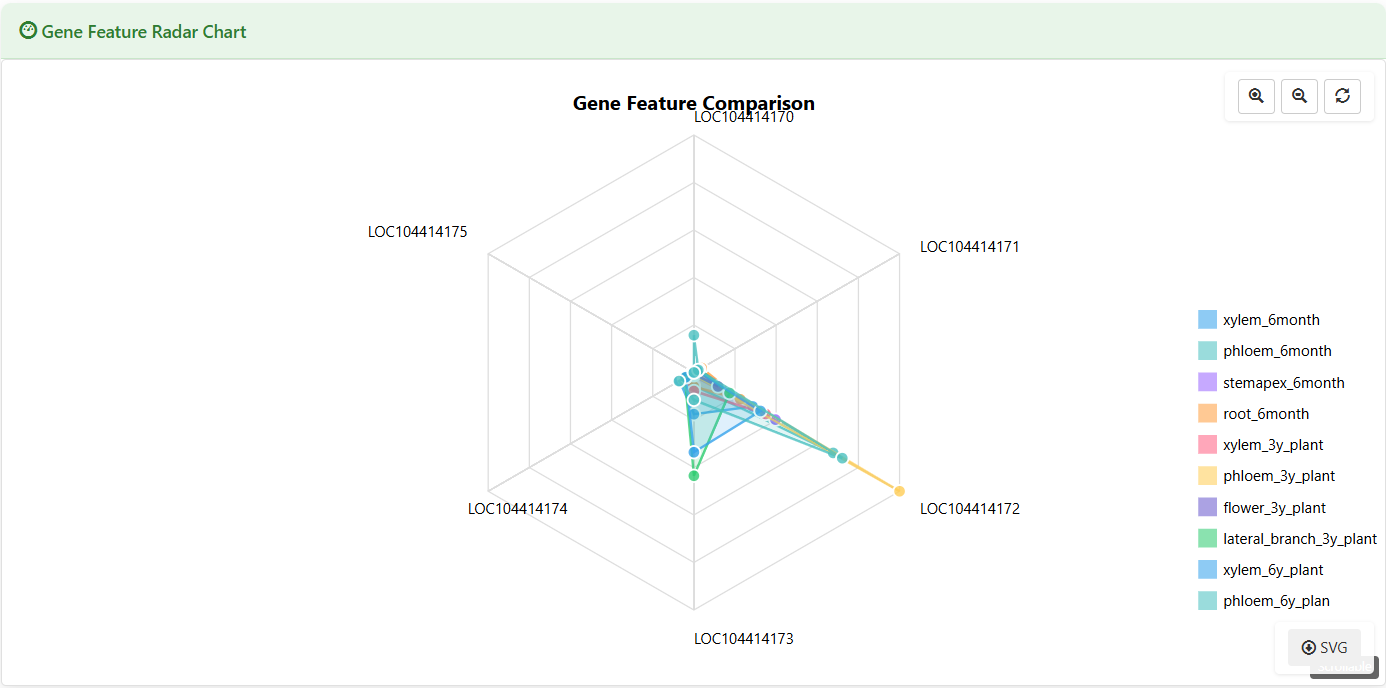
Figure 5.9: Screenshot of Eucalyptus Gene feature radar chart
Polar Area Chart
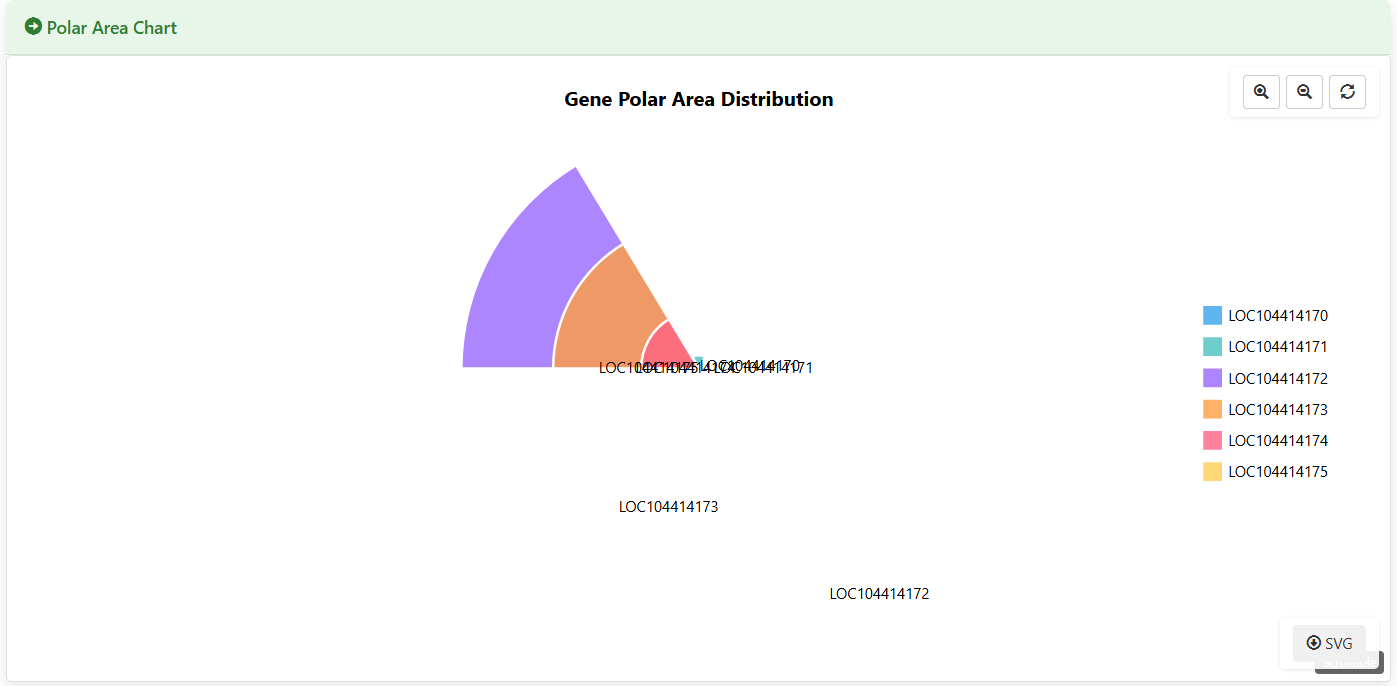
Figure 5.10: Screenshot of Eucalyptus Gene expression polar area chart